features
use cases
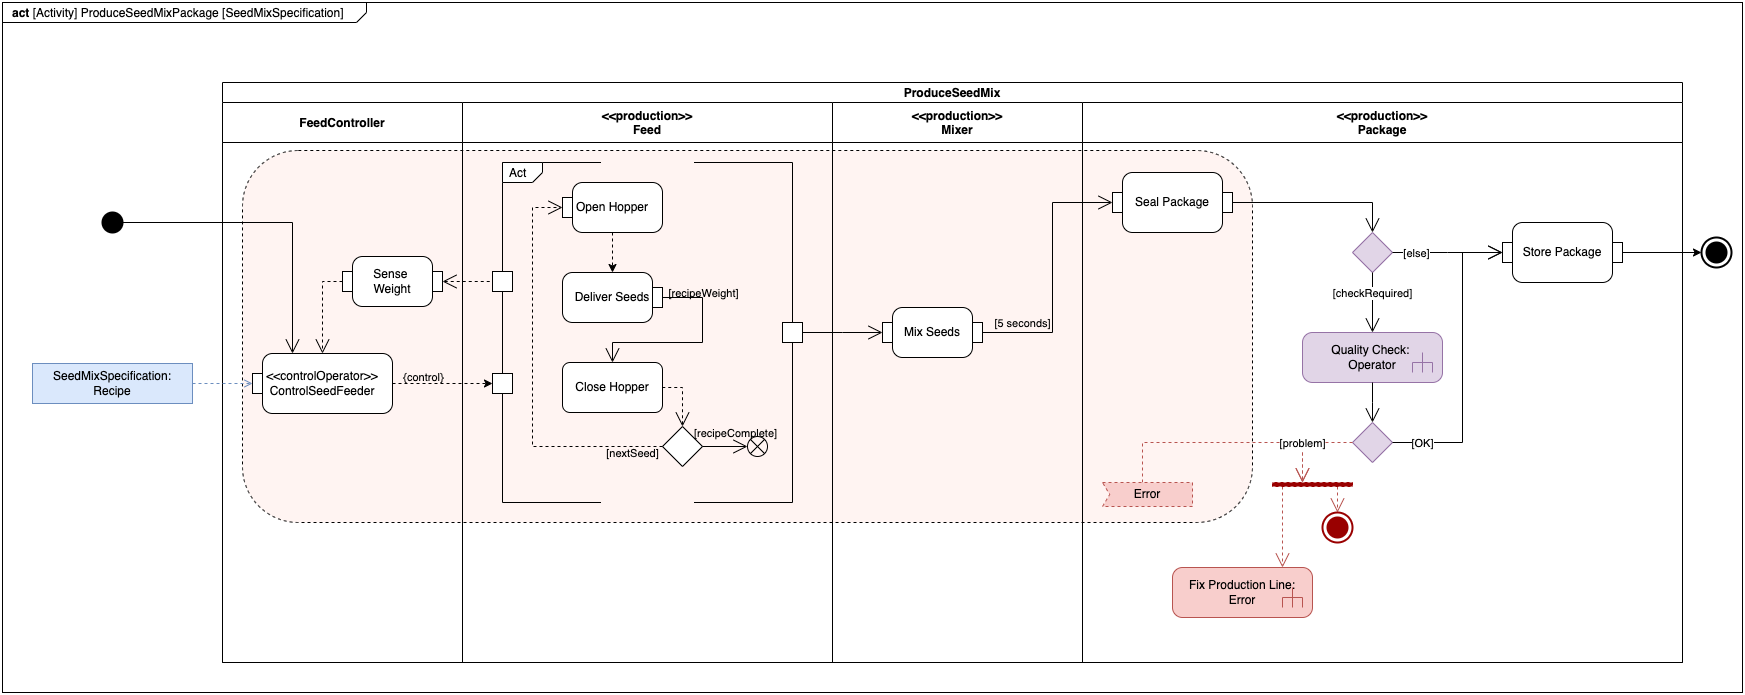
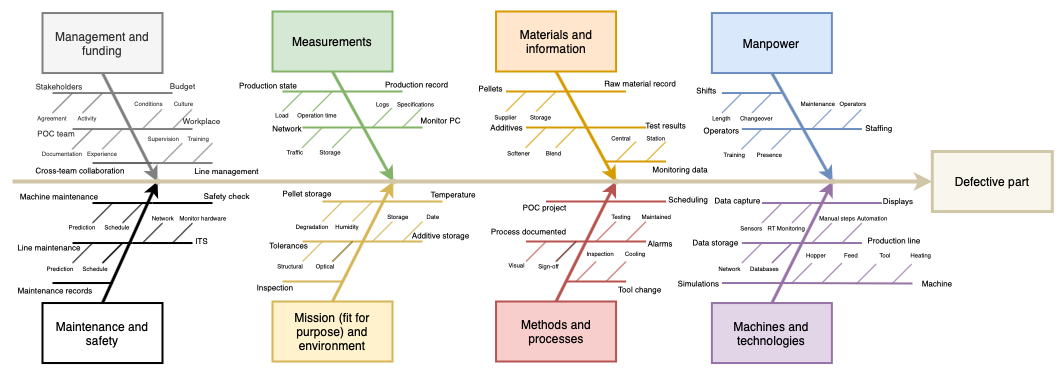
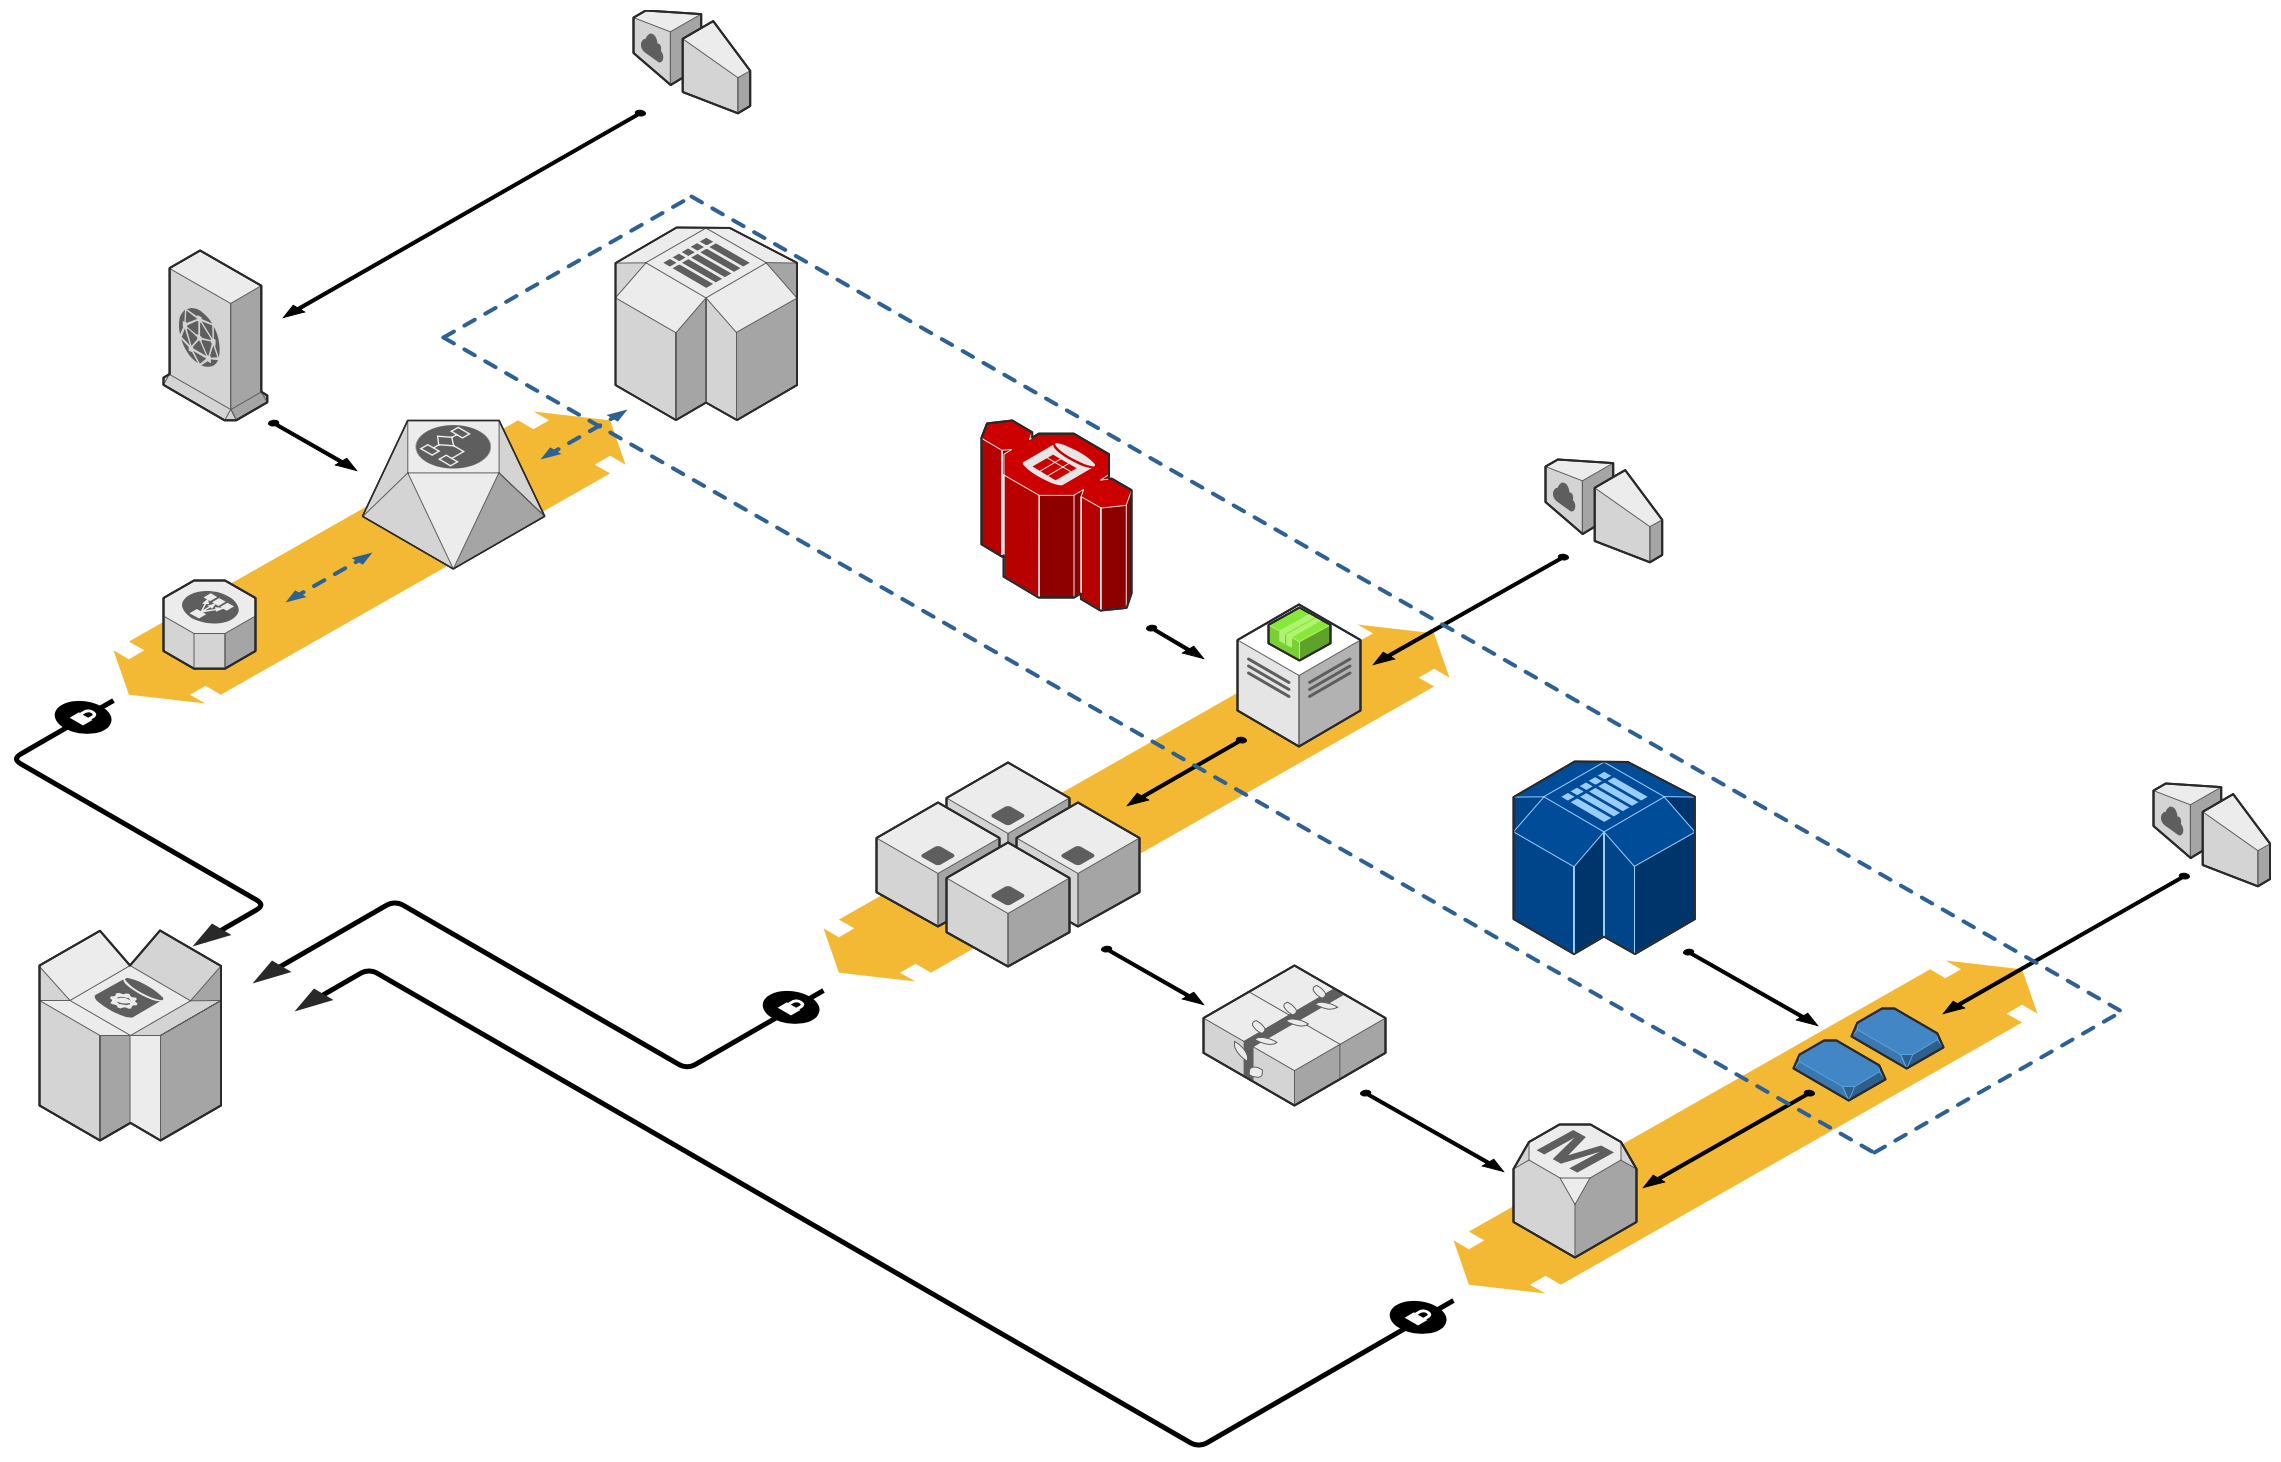
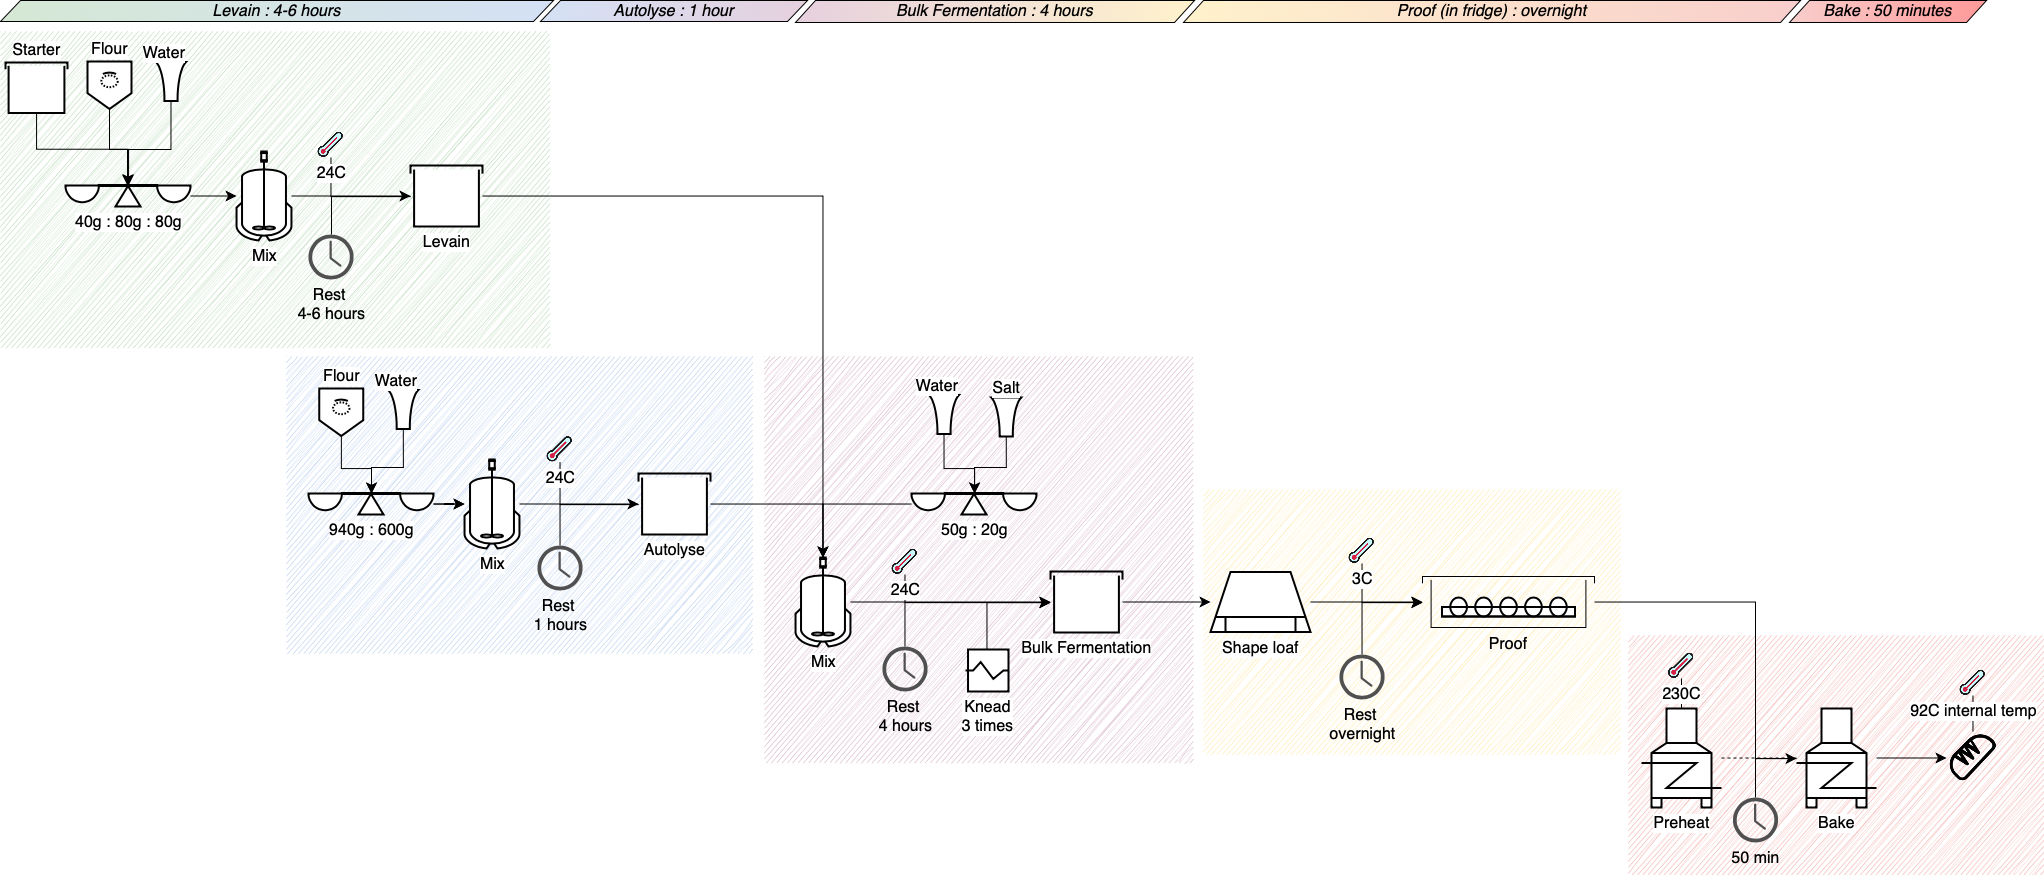
Technical diagrams for manufacturing - process engineering shape library
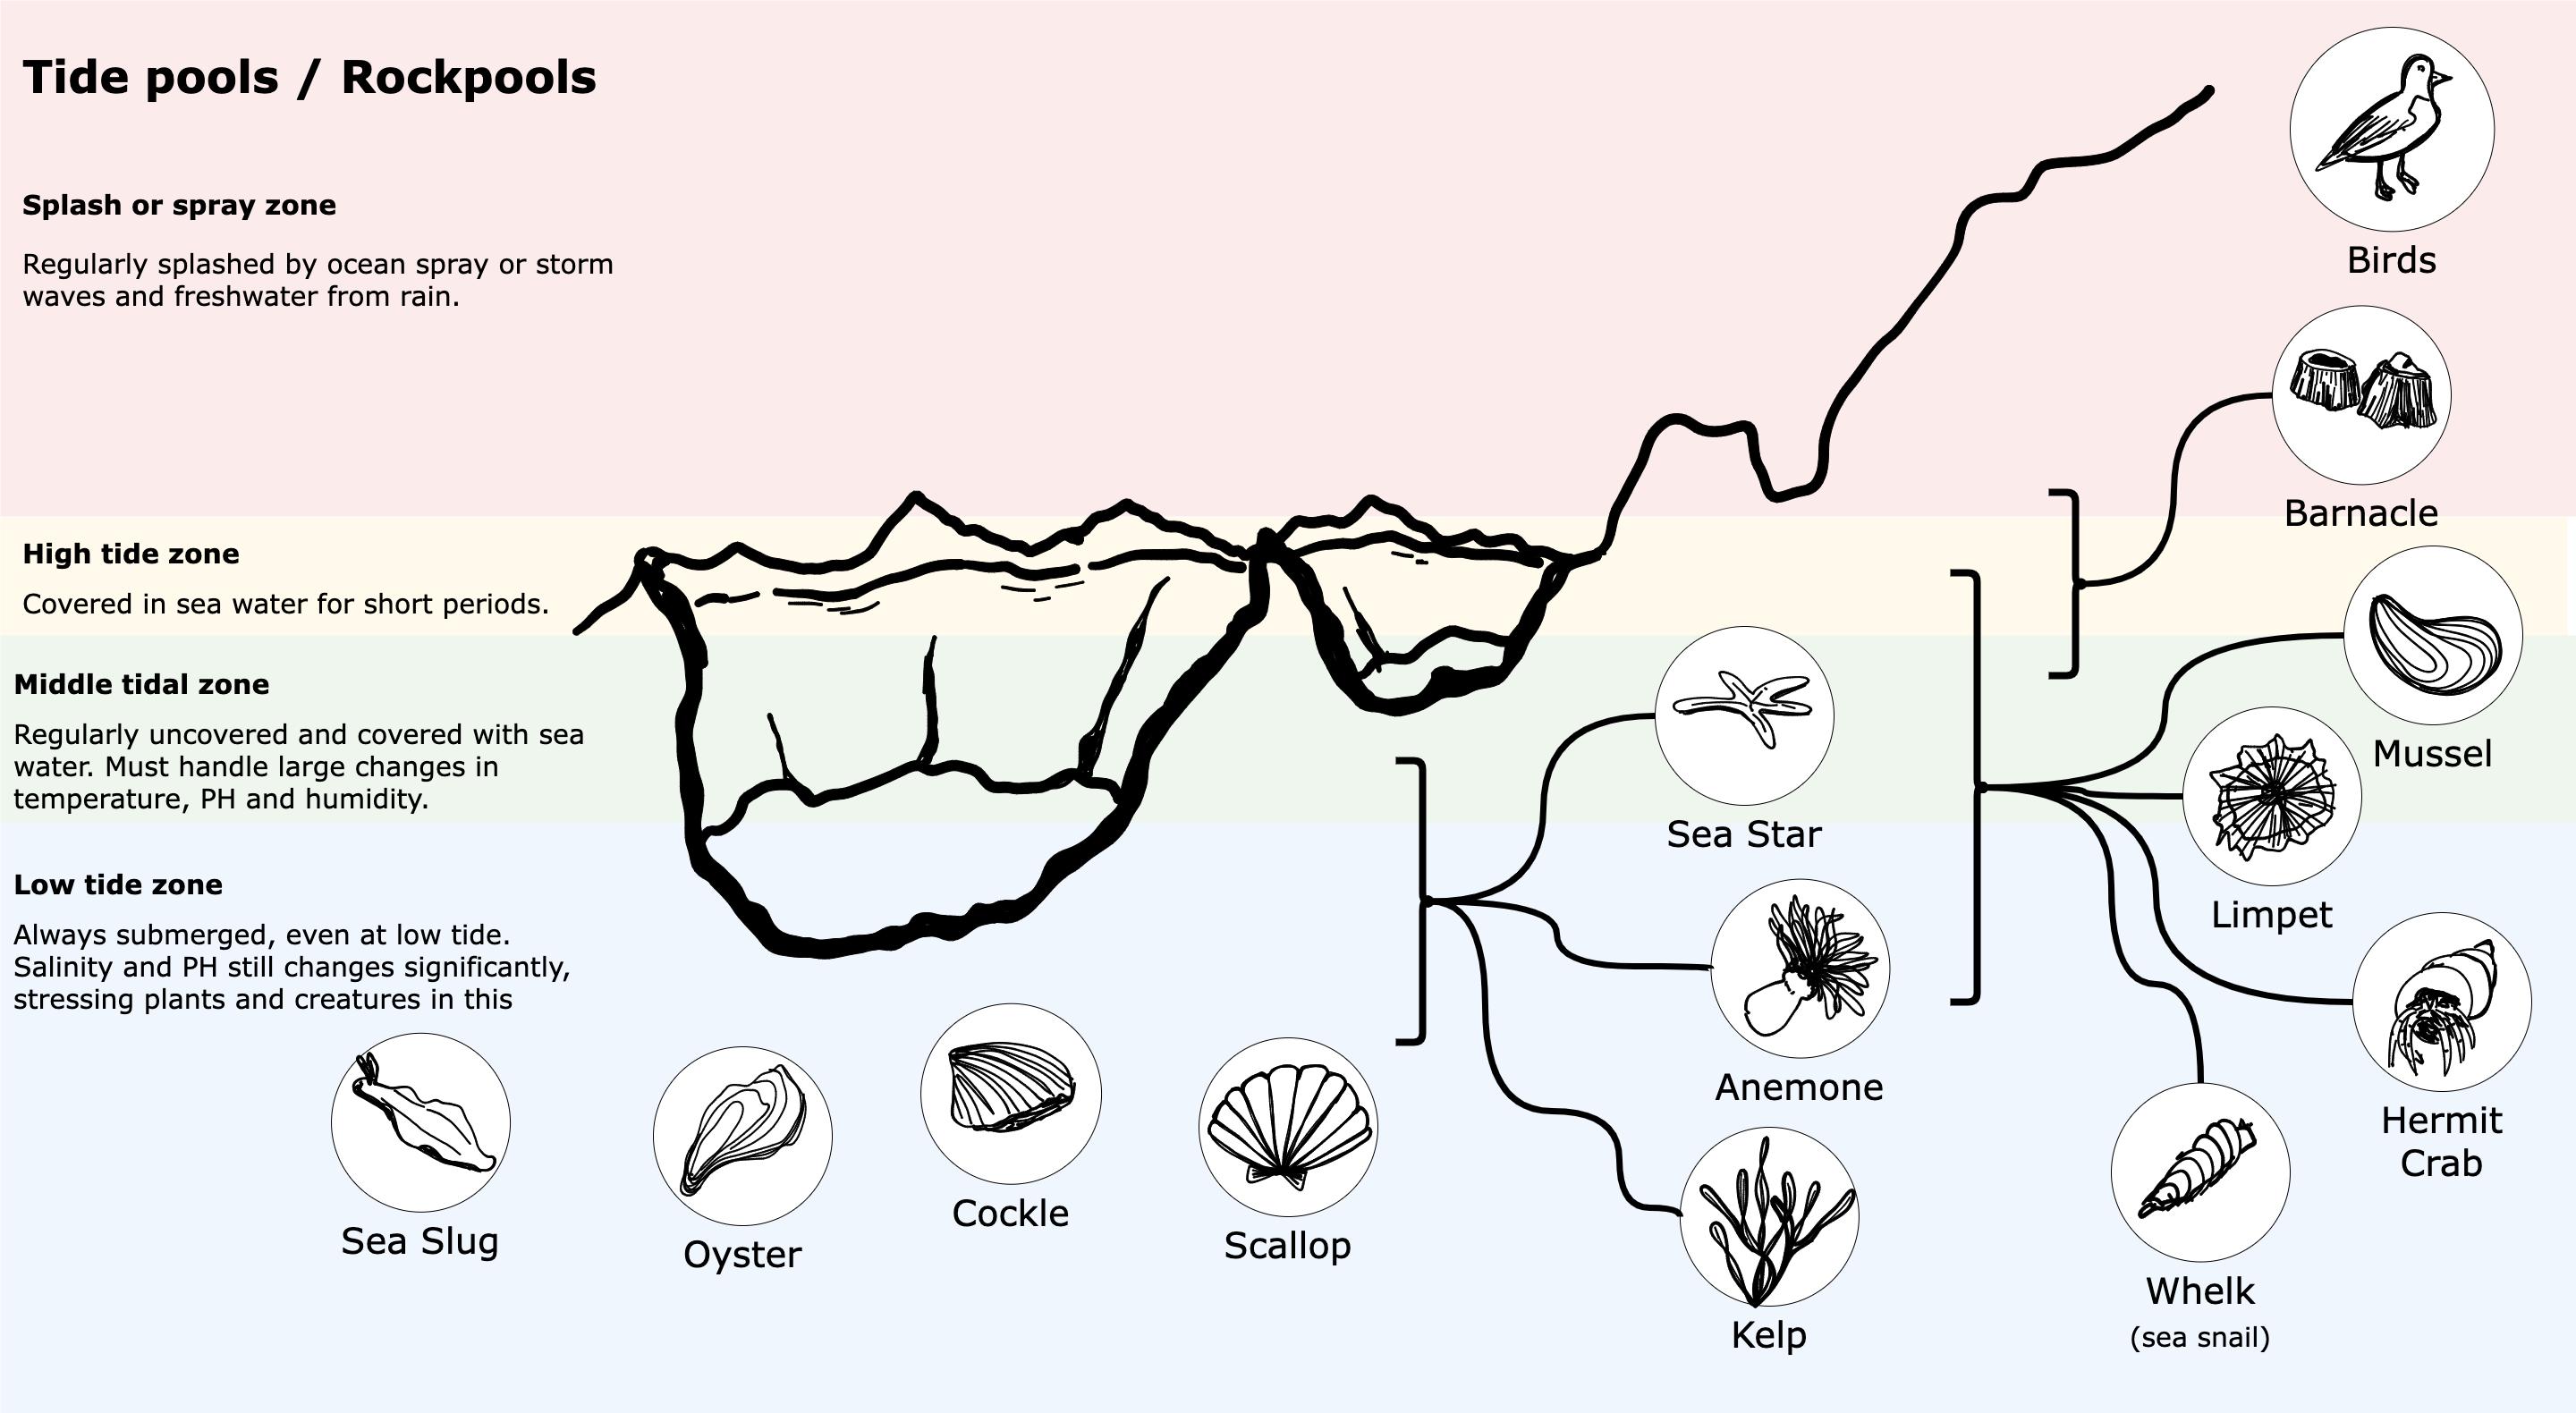
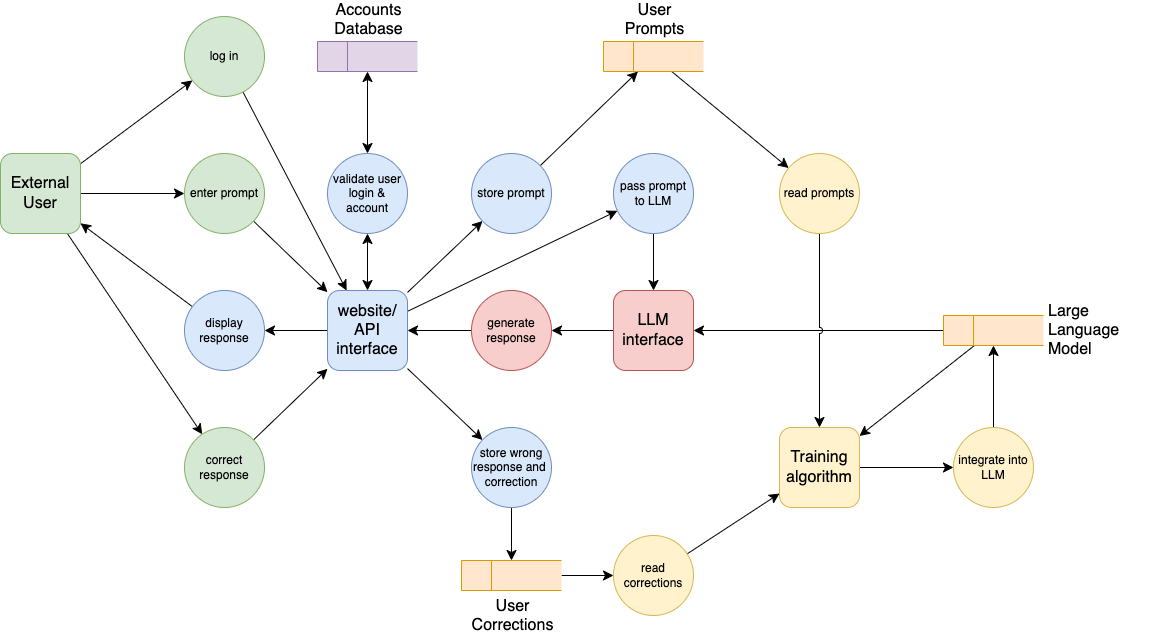
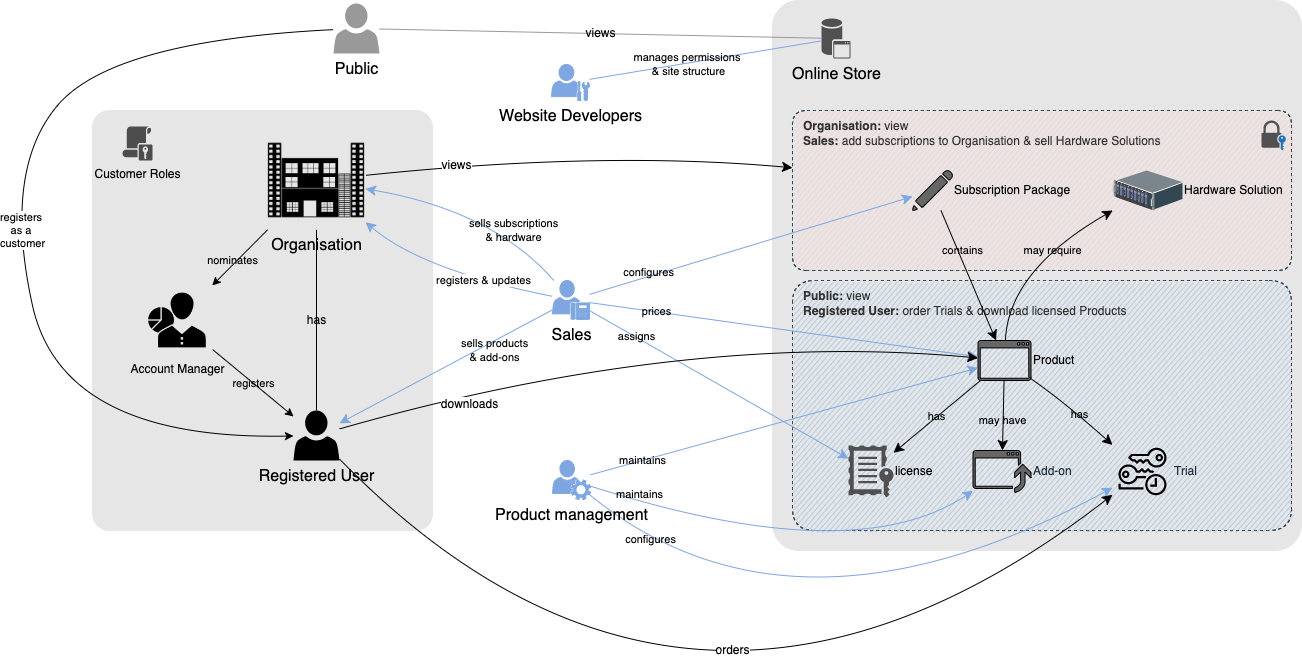
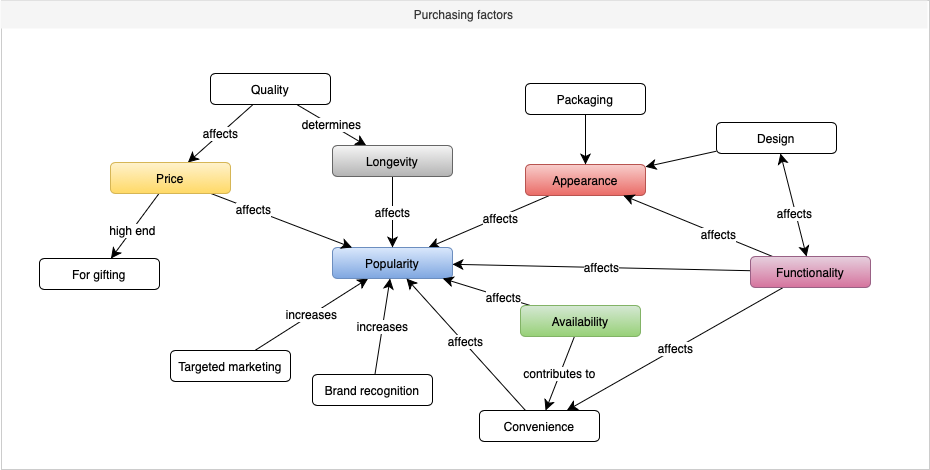
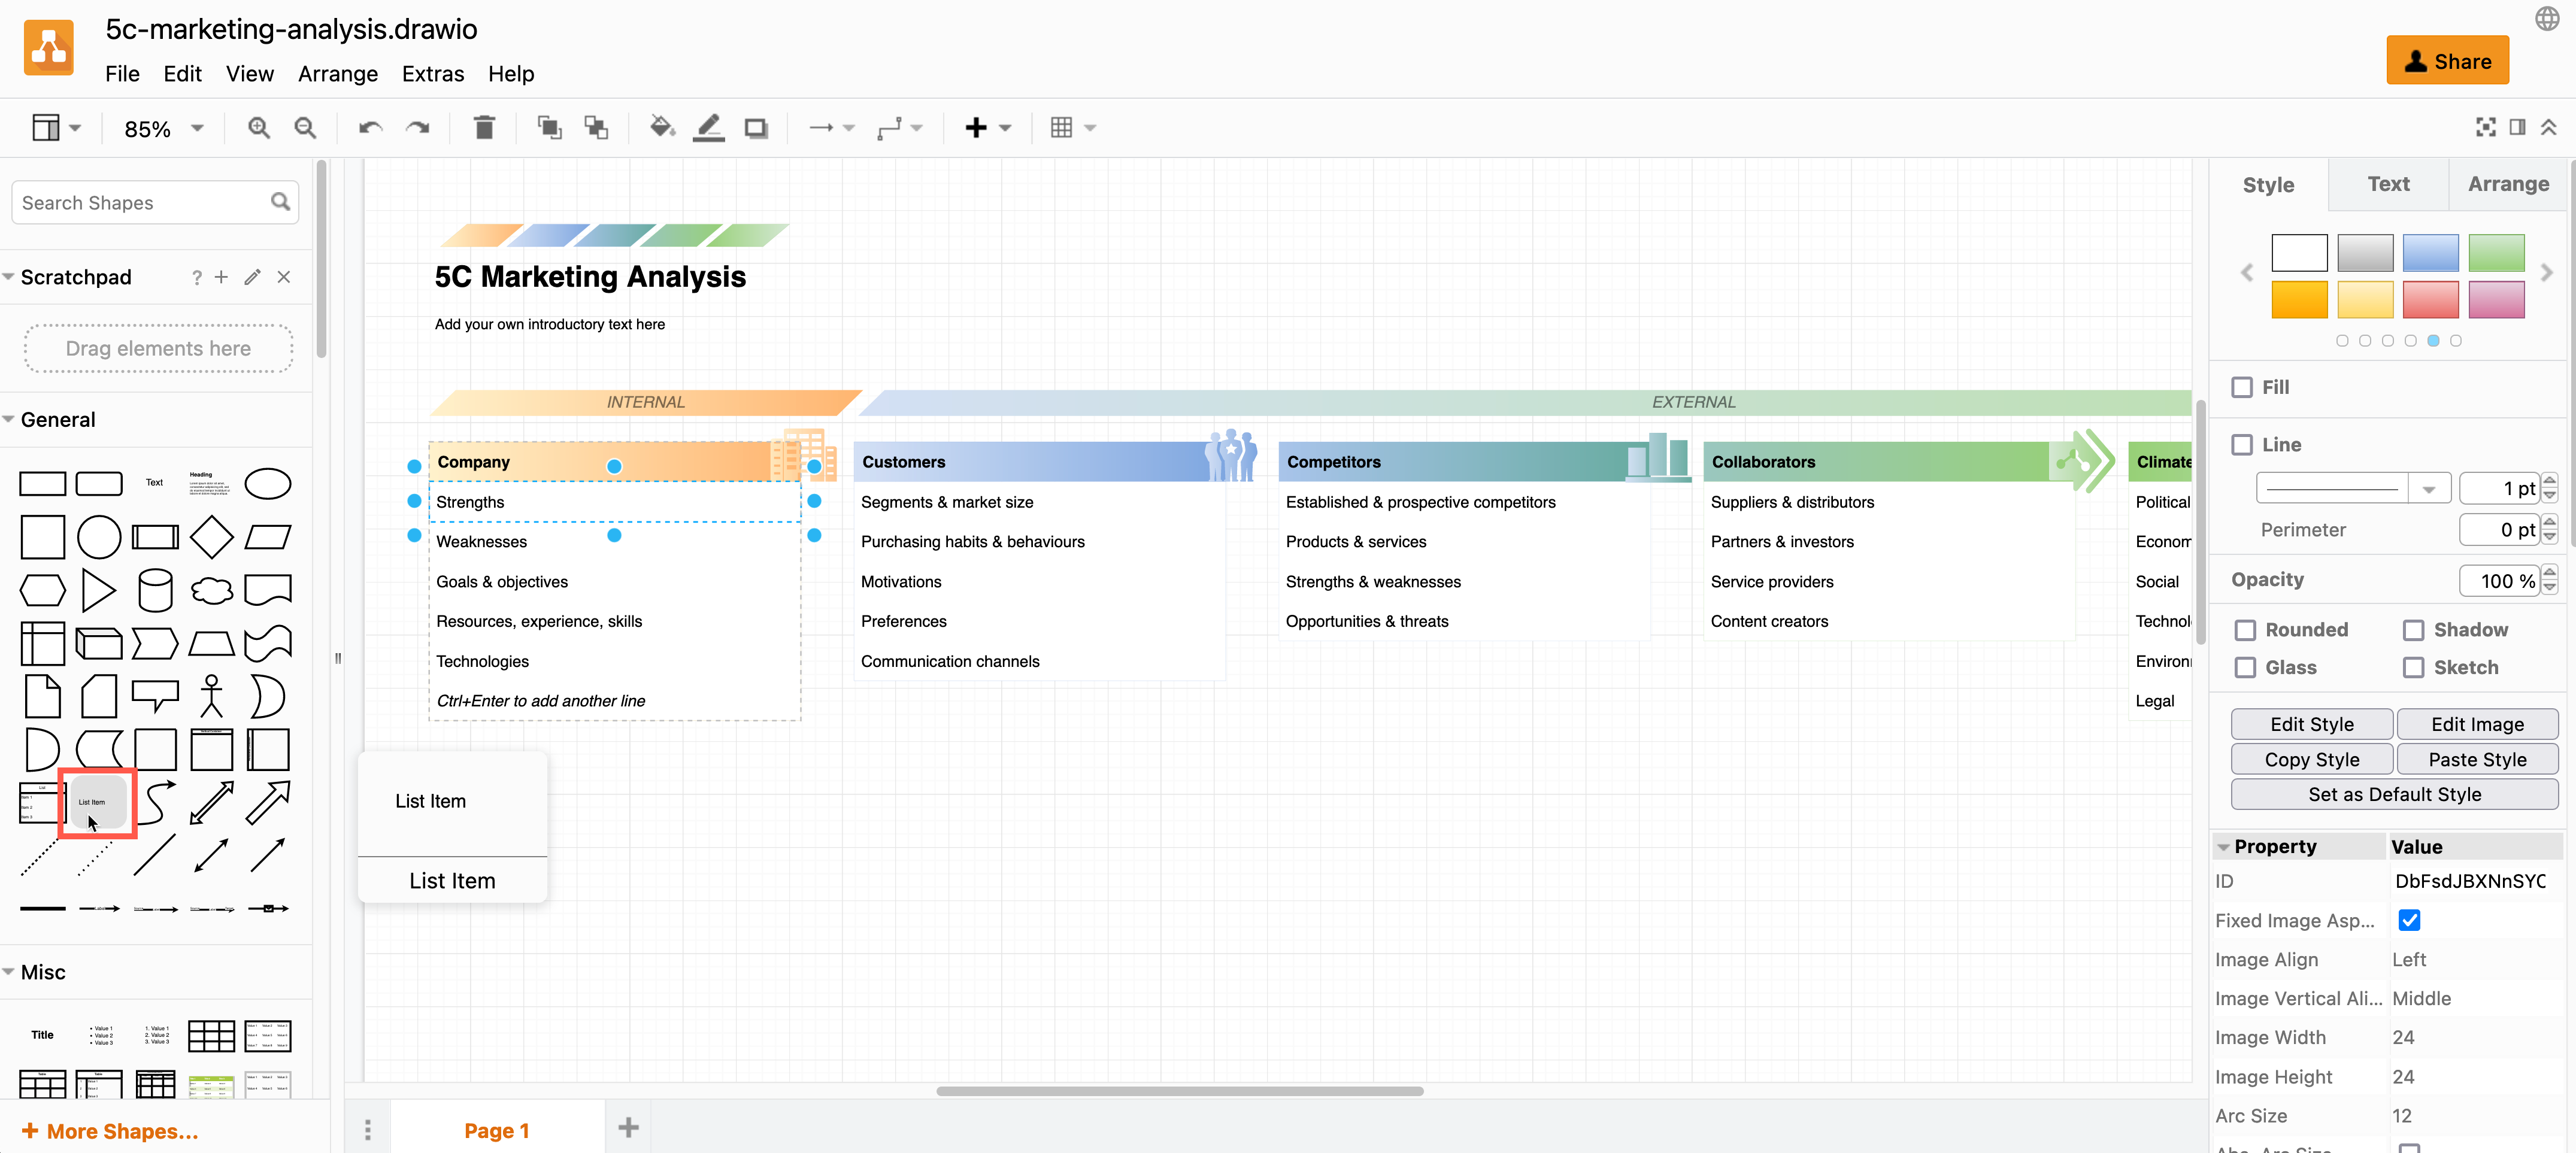
In draw.io, the wide range of shape libraries let you draw many kinds of technical diagrams. The large process engineering shape library (Proc. Eng.) helps you visualise manufacturing processes and production lines. This library also includes various ISO shapes should you need to diagram to specific standards.
03 Apr 2024