Create a variety of T-charts in draw.io
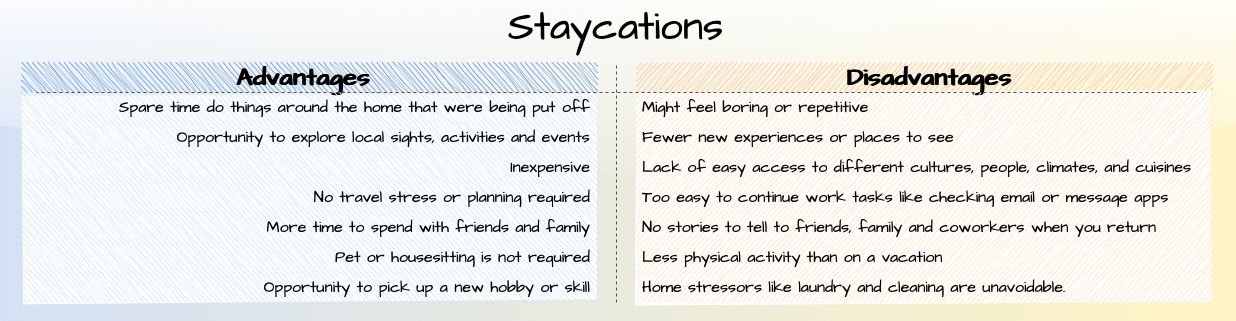
T-charts are a type of graphic organiser or concept map that helps you to evaluate the advantages and disadvantages of anything. They can also be used to contrast two things of the same type, such as physical products, services, processes or data structures, business models, applications, situations, etc.
While they are most commonly used to contrast the advantages and disadvantages of something, T-charts can also be used to explore topics in a number of ways:
- cause and effect to help discover the root cause of problems
- before and after a solution is implemented
- past and present to compare processes
- problems and solutions
- strengths and weaknesses
Students can also use t-charts during research and essay preparation to organise evidence and sources.
- true or false
- facts or opinions
- valid arguments vs distractions
- trusted vs untrusted
- primary vs secondary sources
Draw a t-chart
There are so many different ways you can design a t-chart in draw.io. If you want a collaborative online whiteboard - use sticky note shapes. For fast text entry, list shapes and table shapes are best. Use a mindmap or other icons for a t-chart attractive enough to use in an infographic or presentation slide.
Sticky notes
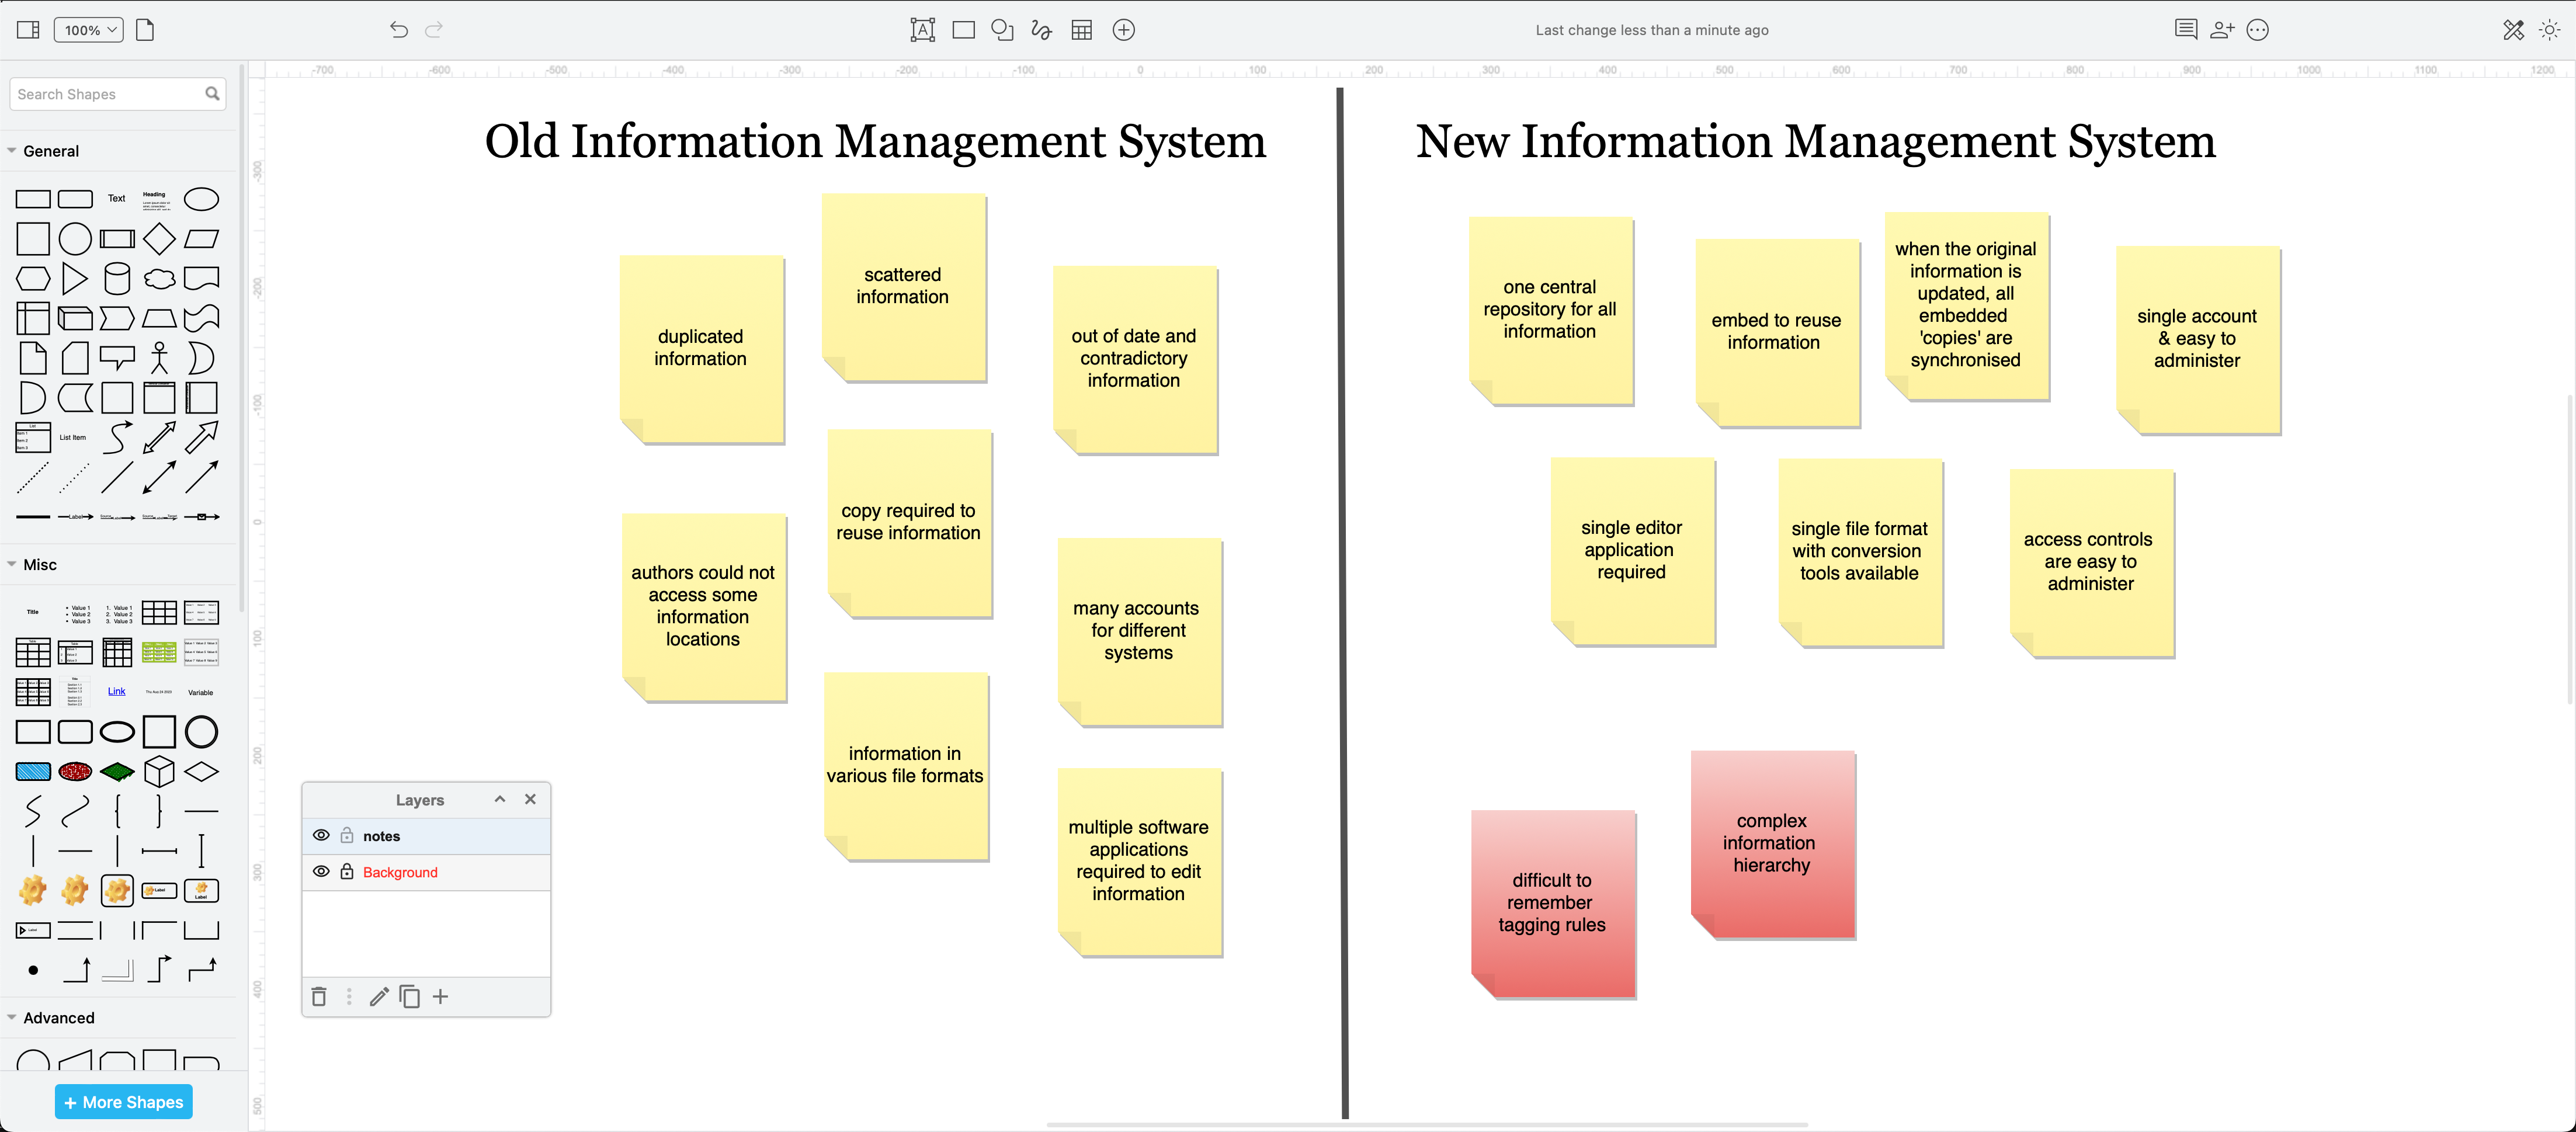
Divide the drawing canvas into two sides and use rectangles or sticky note shapes for each point.
When multiple people are editing a diagram simultaneously, place the divider and labels on a locked background layer. A second layer lets people add note shapes without unexpectedly changing the ‘background’.
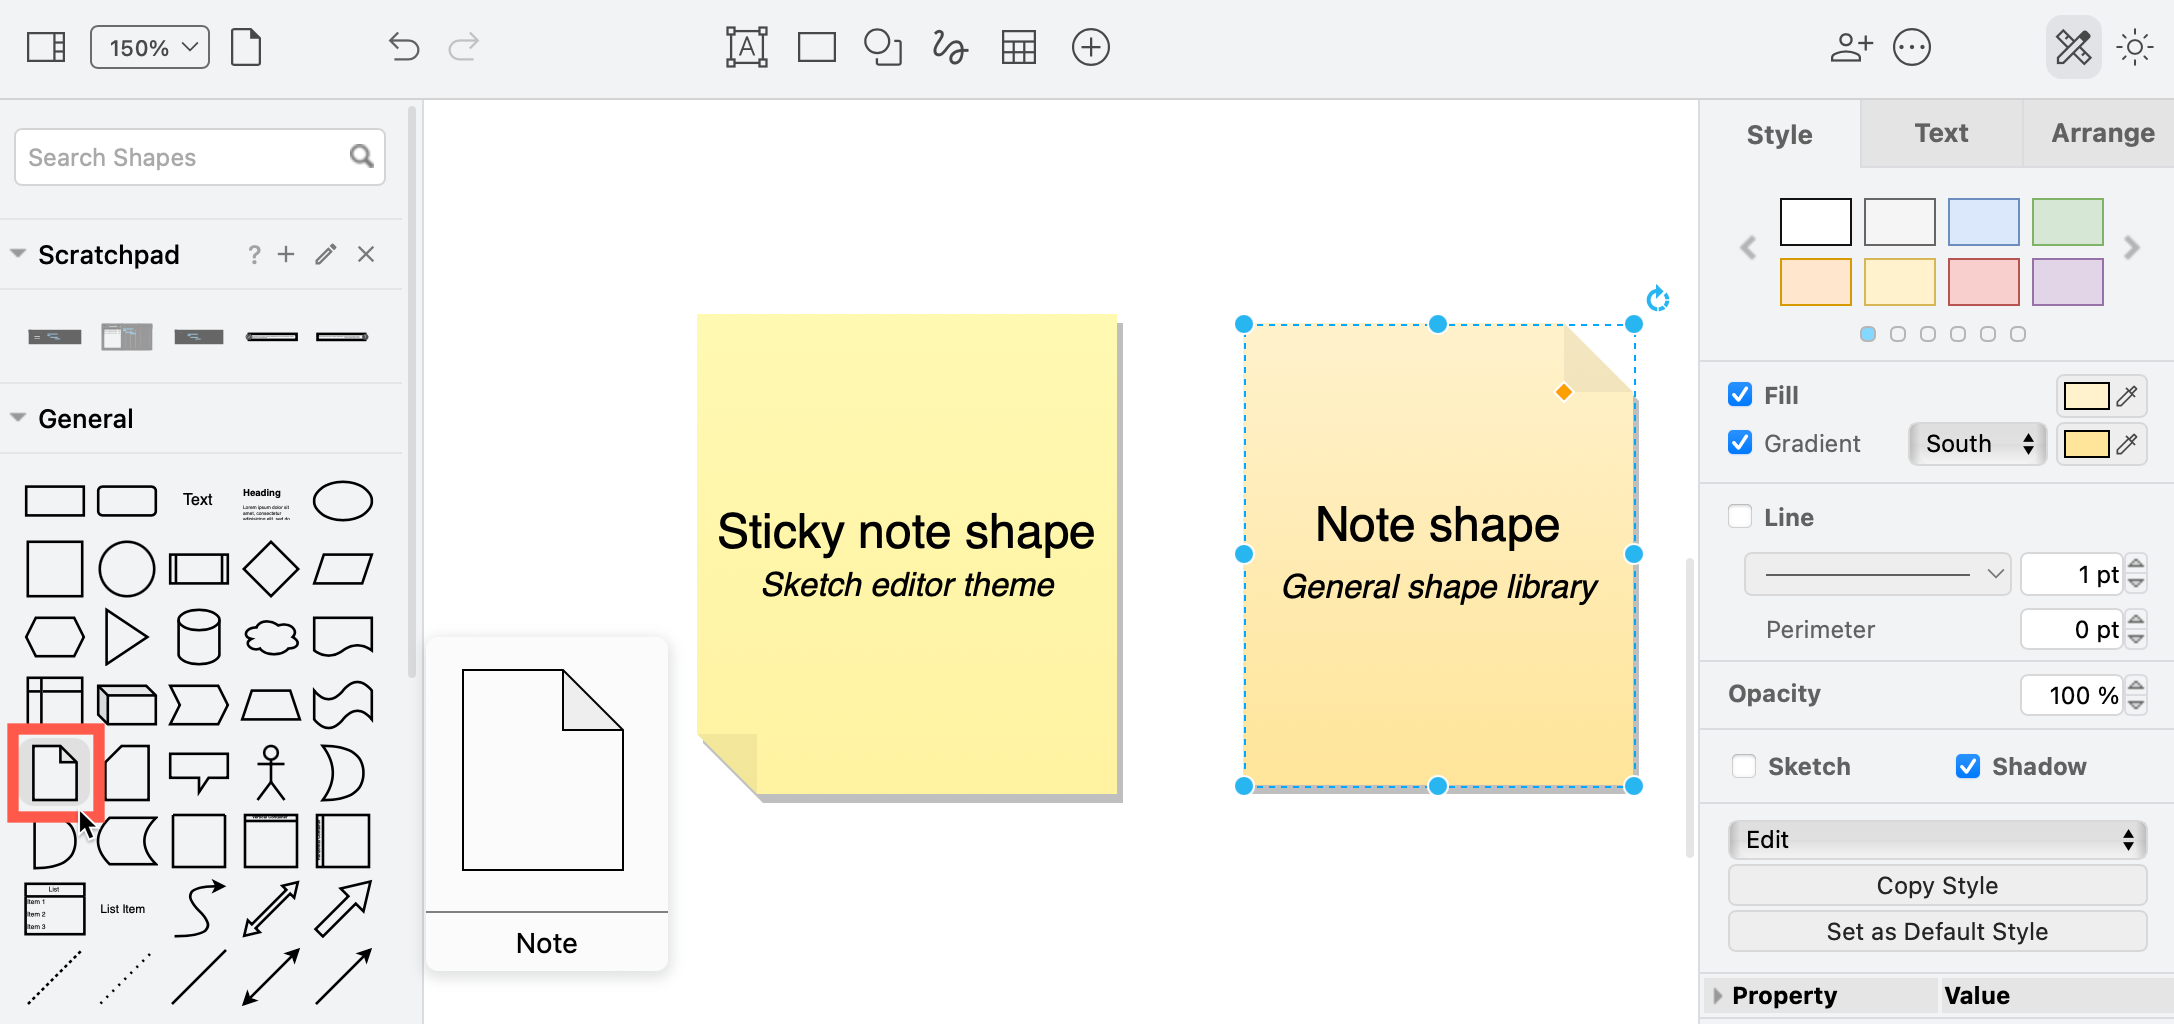
Tip: The yellow sticky note shape is available as a shortcut shape in the toolbar in the Sketch editor theme. In all other themes, copy that shape or use the Note shape and colour it in the Style tab of the format panel.
List and table shapes
Use the ordered list or unordered list shapes in the Misc shape library if you want bulleted or numbered items.
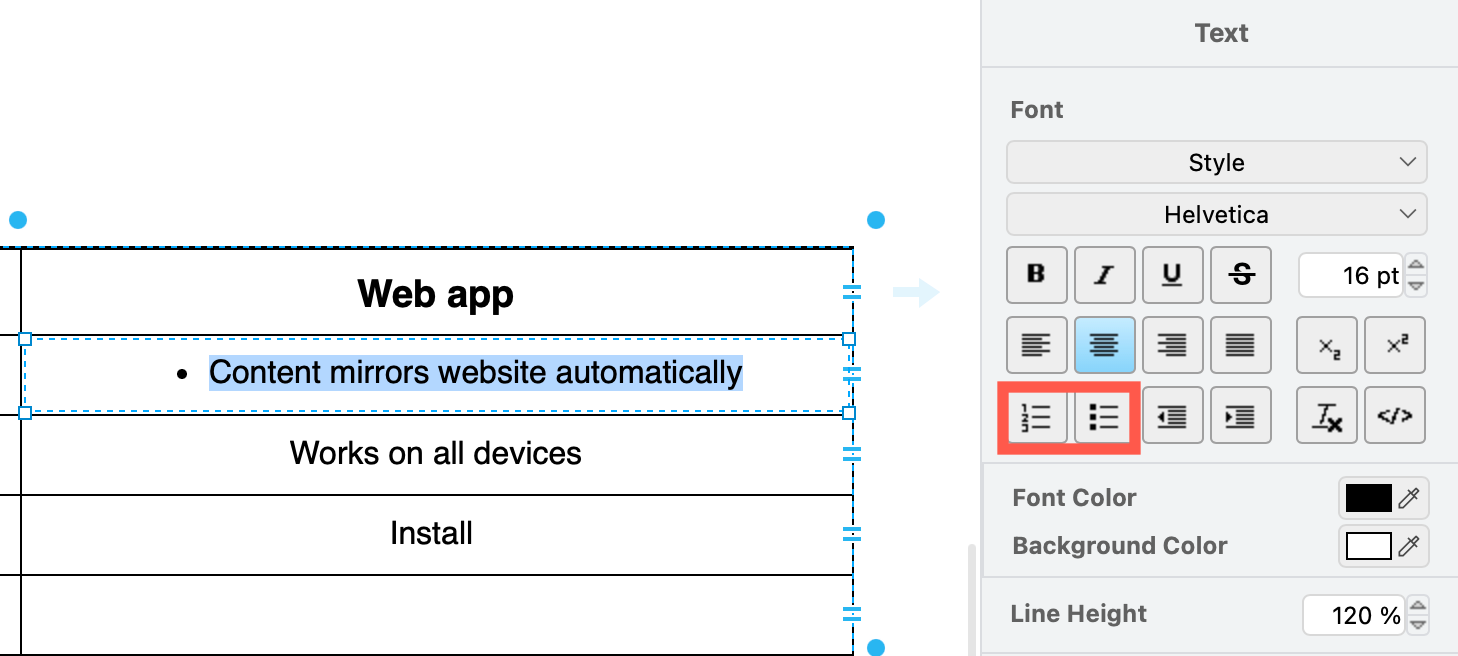
- Double-click to select the text inside the shape, table cell or list.
- Select the Bulleted List or Numbered List format option in the Text tab of the format panel.
Use a list shape as in the first example at the start of this page, or a simple table shape (below) to enter text quickly and keep it neatly aligned.
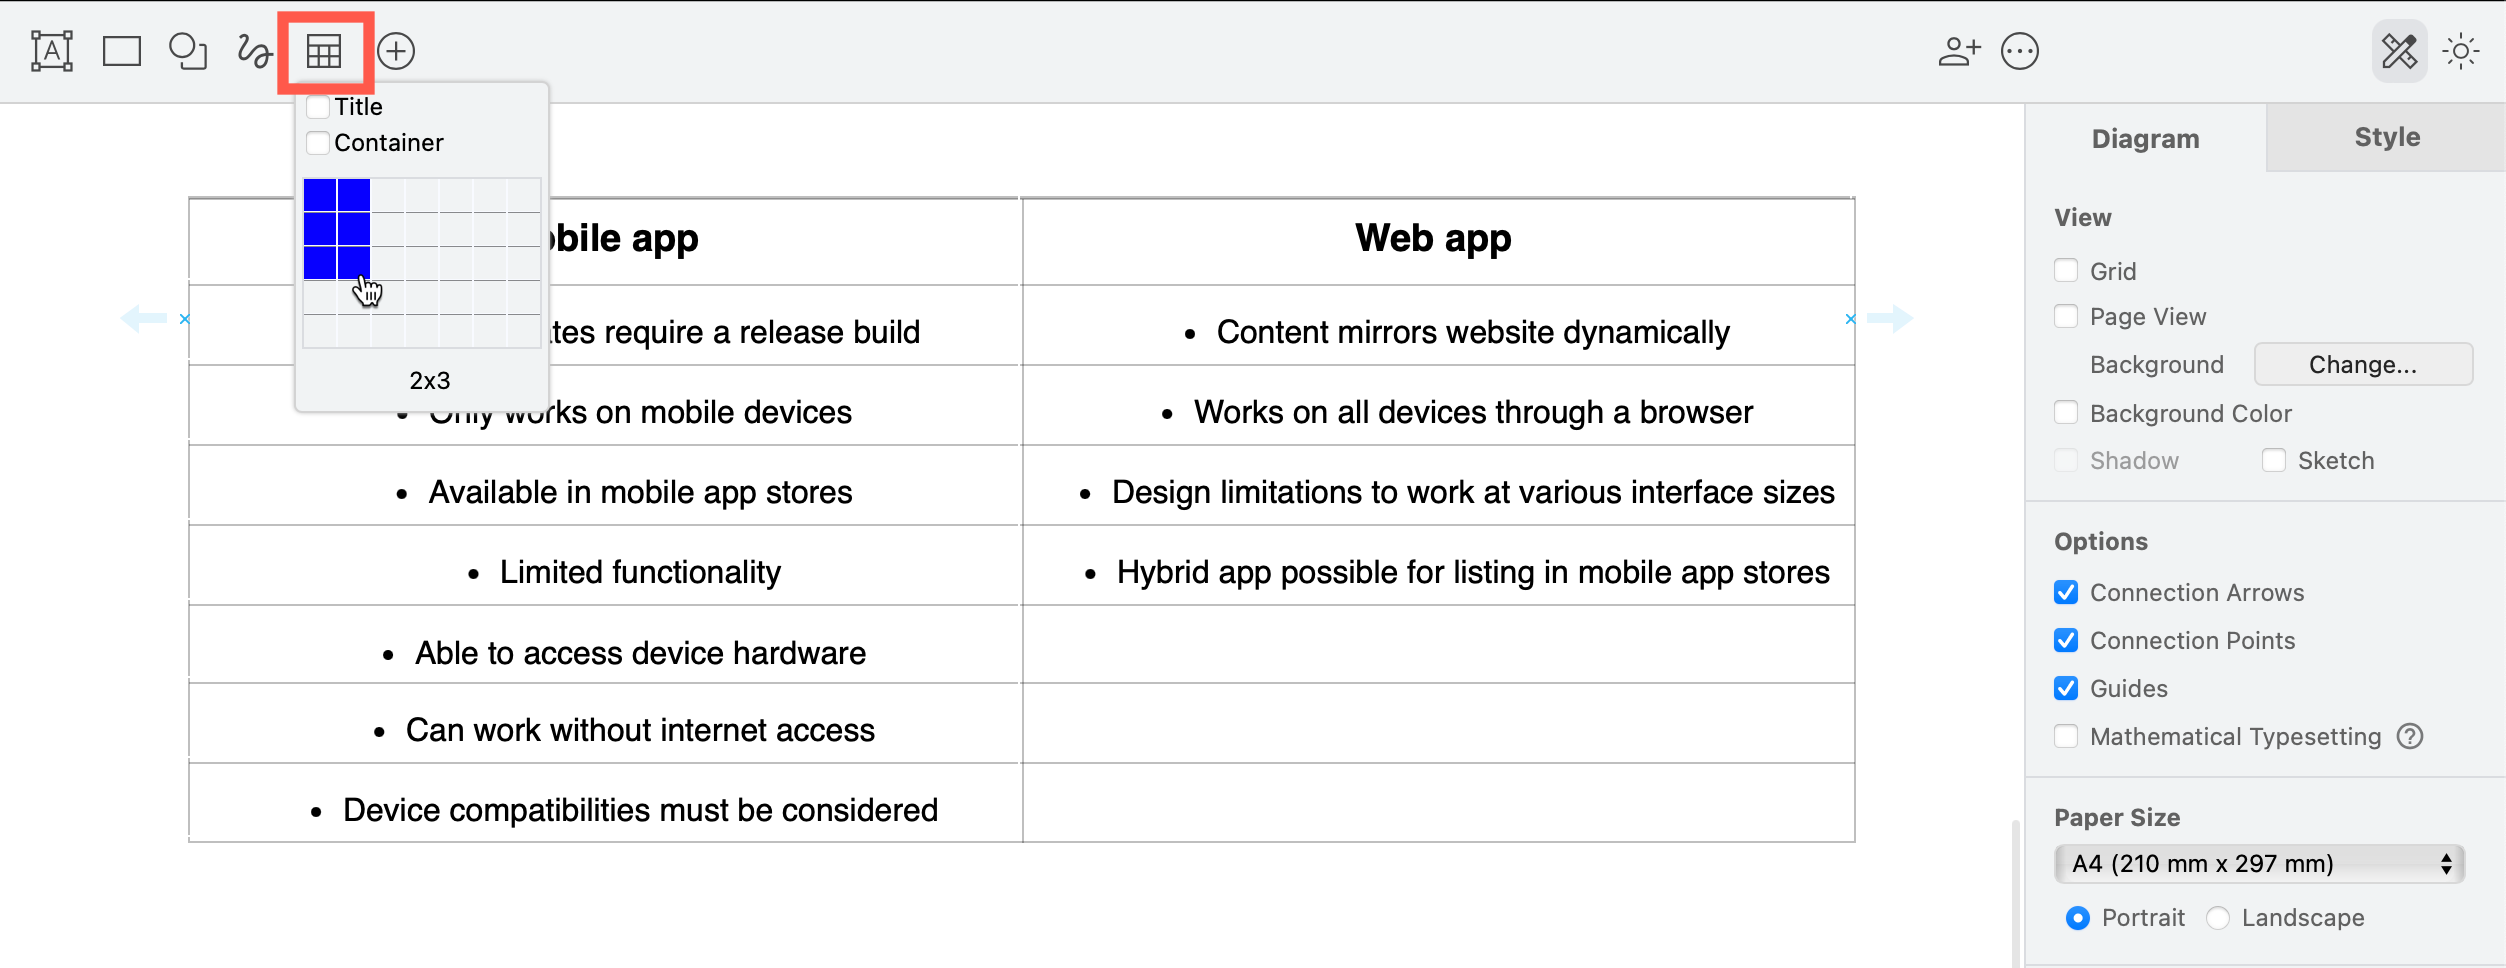
Use keyboard shortcuts for tables and list shapes to enter text faster.
Mindmaps
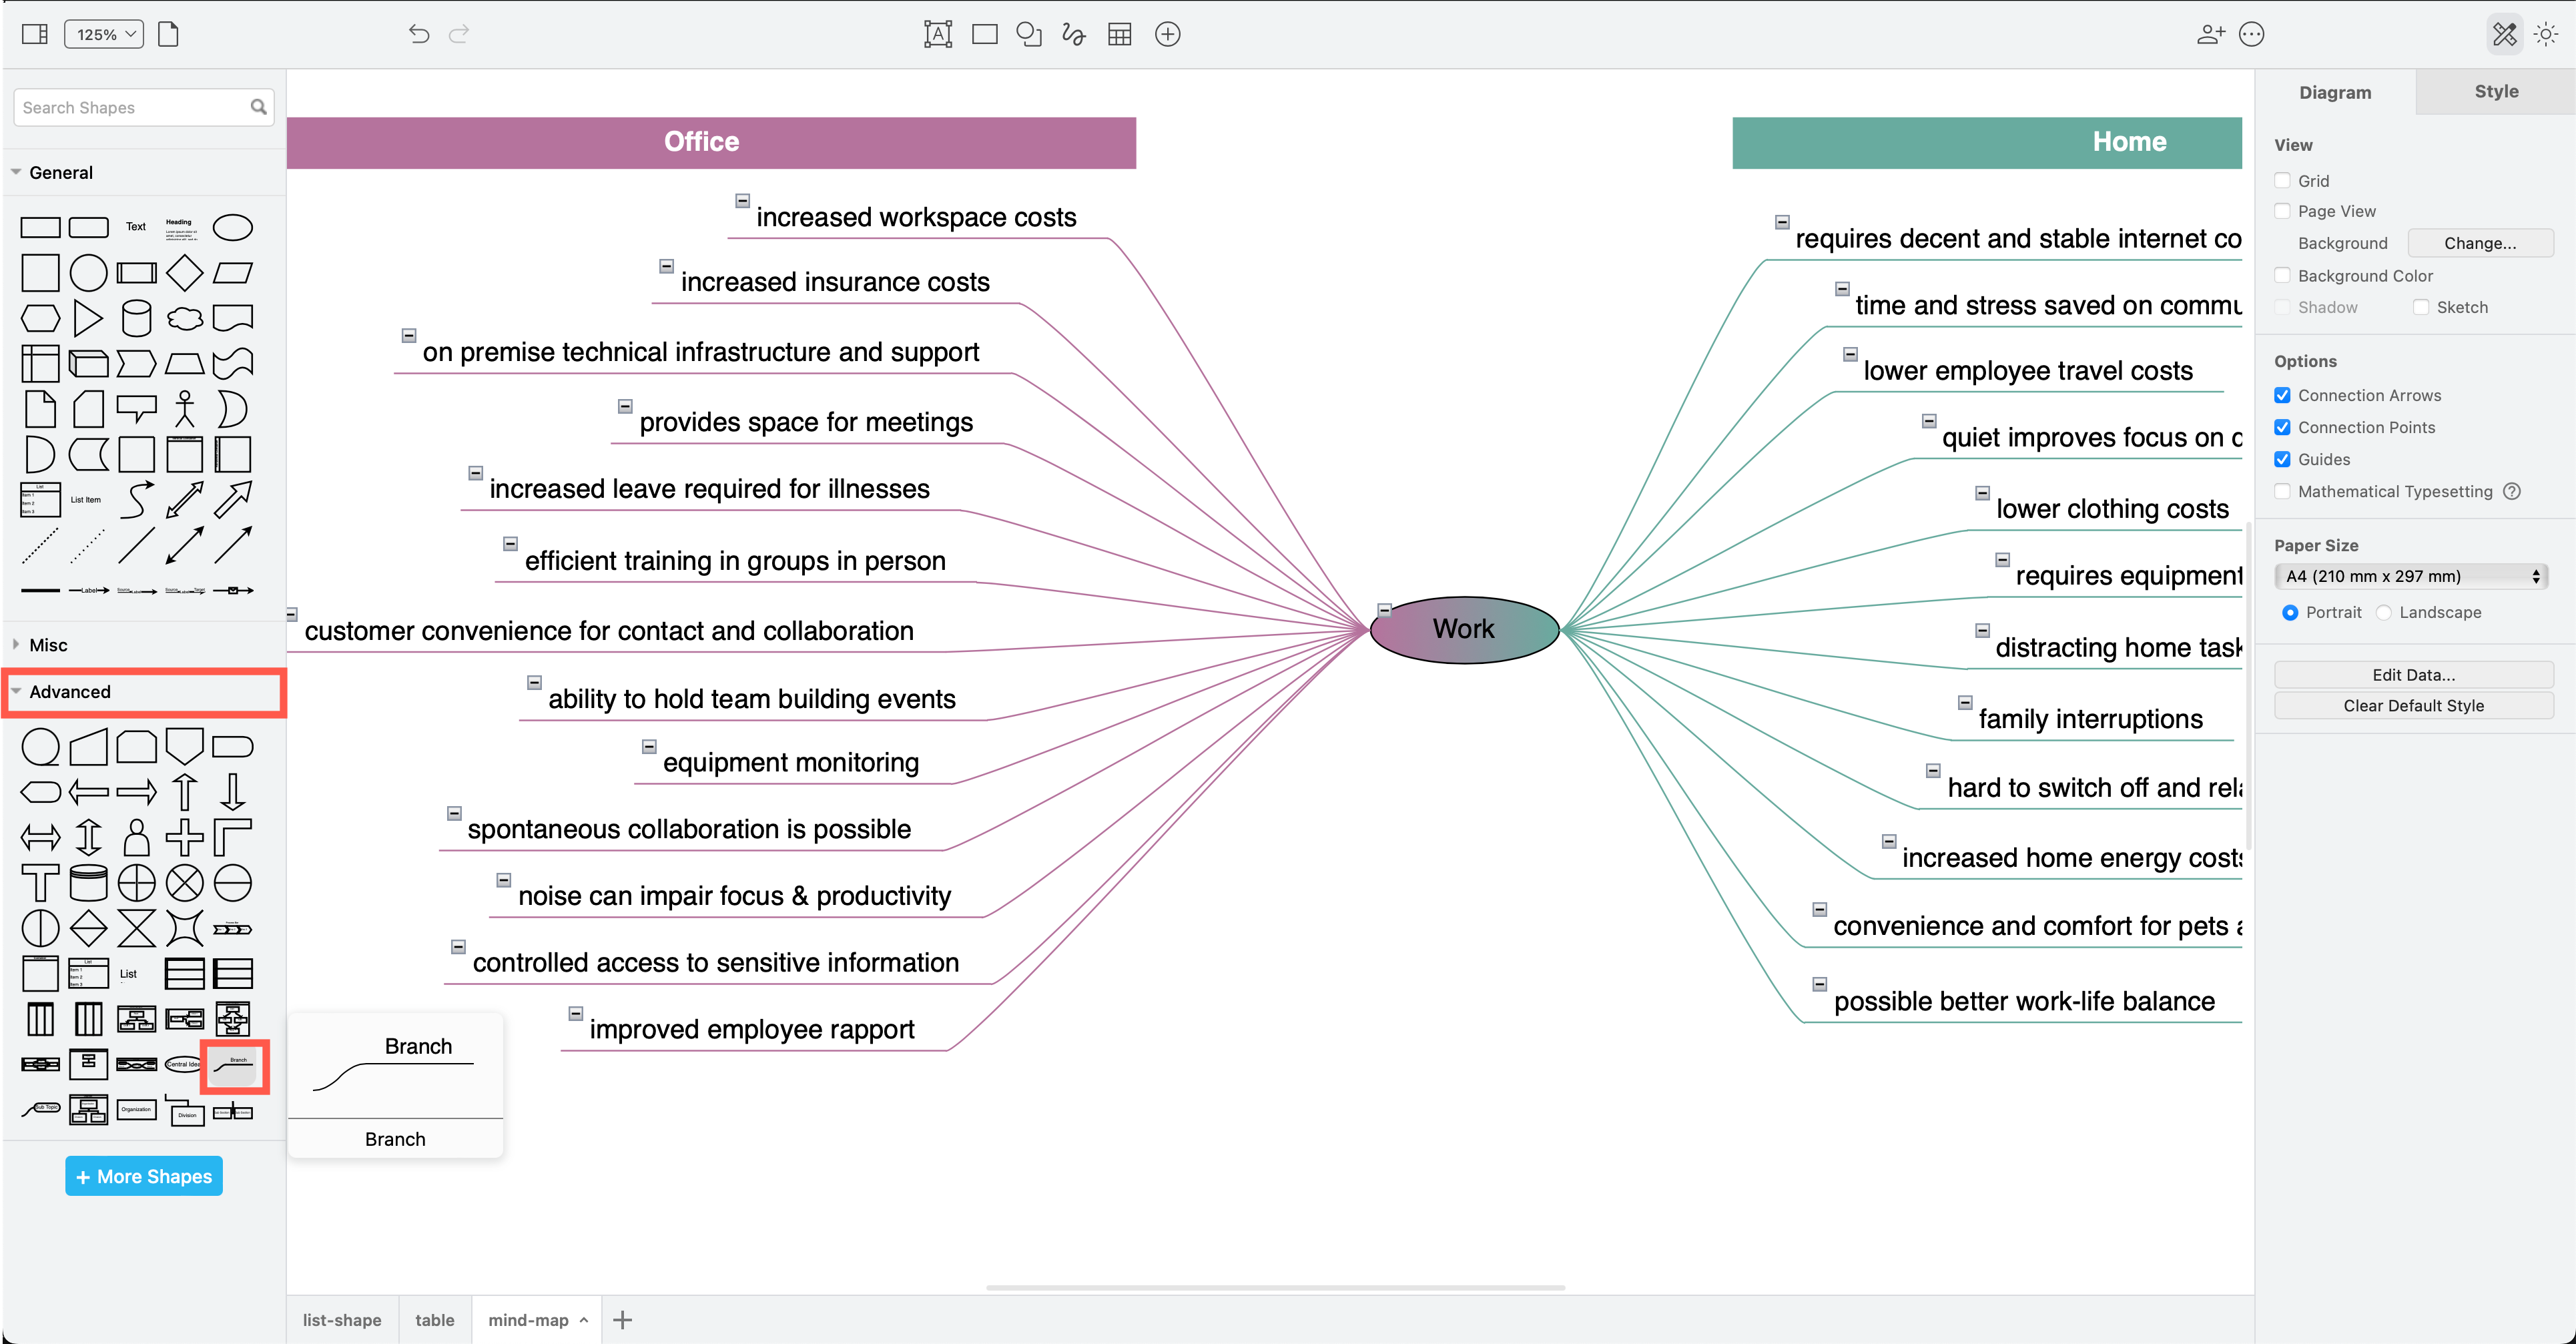
Use the mindmap shapes in the Advanced shape library and keep all of the branches to one side or another of the central topic.
Infographics and slides
Search for and use icons, clip art, infographic shapes and creative connectors to draw an attractive T-chart for a poster, presentation slide or infographic. This template example uses shapes from the Infographic and Office > Concepts shape libraries.
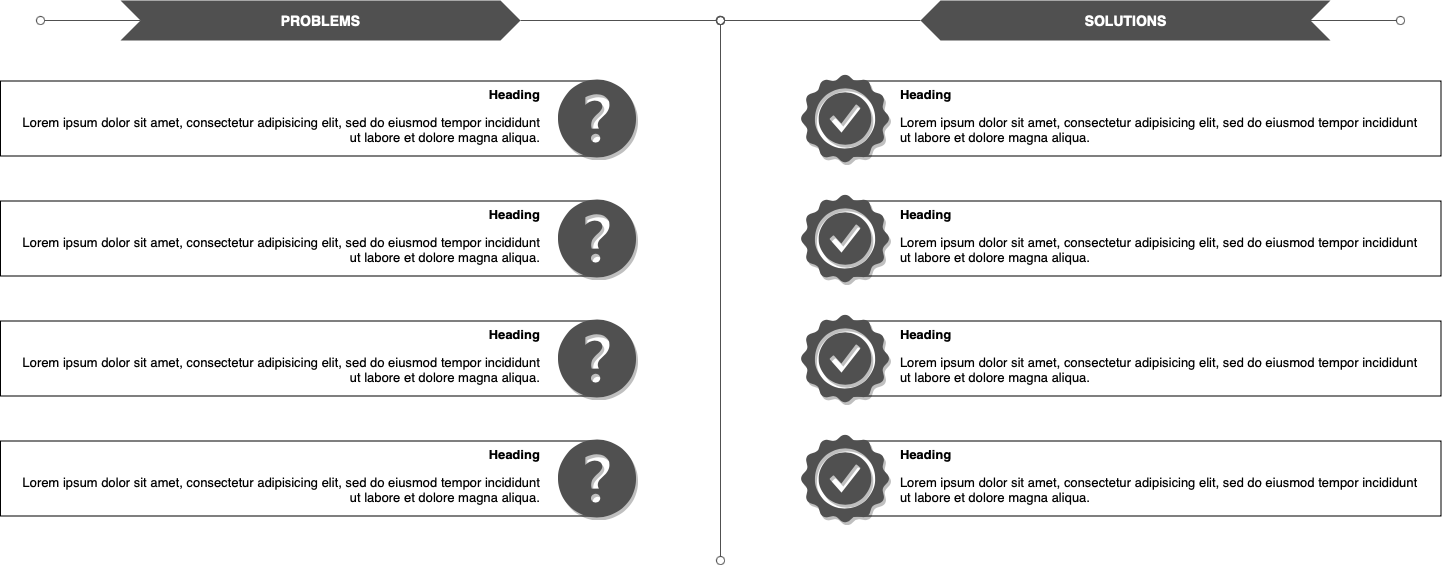
For more infographic templates and examples of many different types of diagrams, please see our drawio-diagrams repository on GitHub.
More complex than a T-chart?
T-charts are quite limited as they are usually used for quick brainstorming of pros and cons or problems and solutions. Other types of diagrams are more suited to visualise more complex concepts.
For example, use a Venn diagram to compare multiple things, a concept map to show complex relationships, or a fishbone diagram for a root cause analysis.