Draw freehand infographics in draw.io
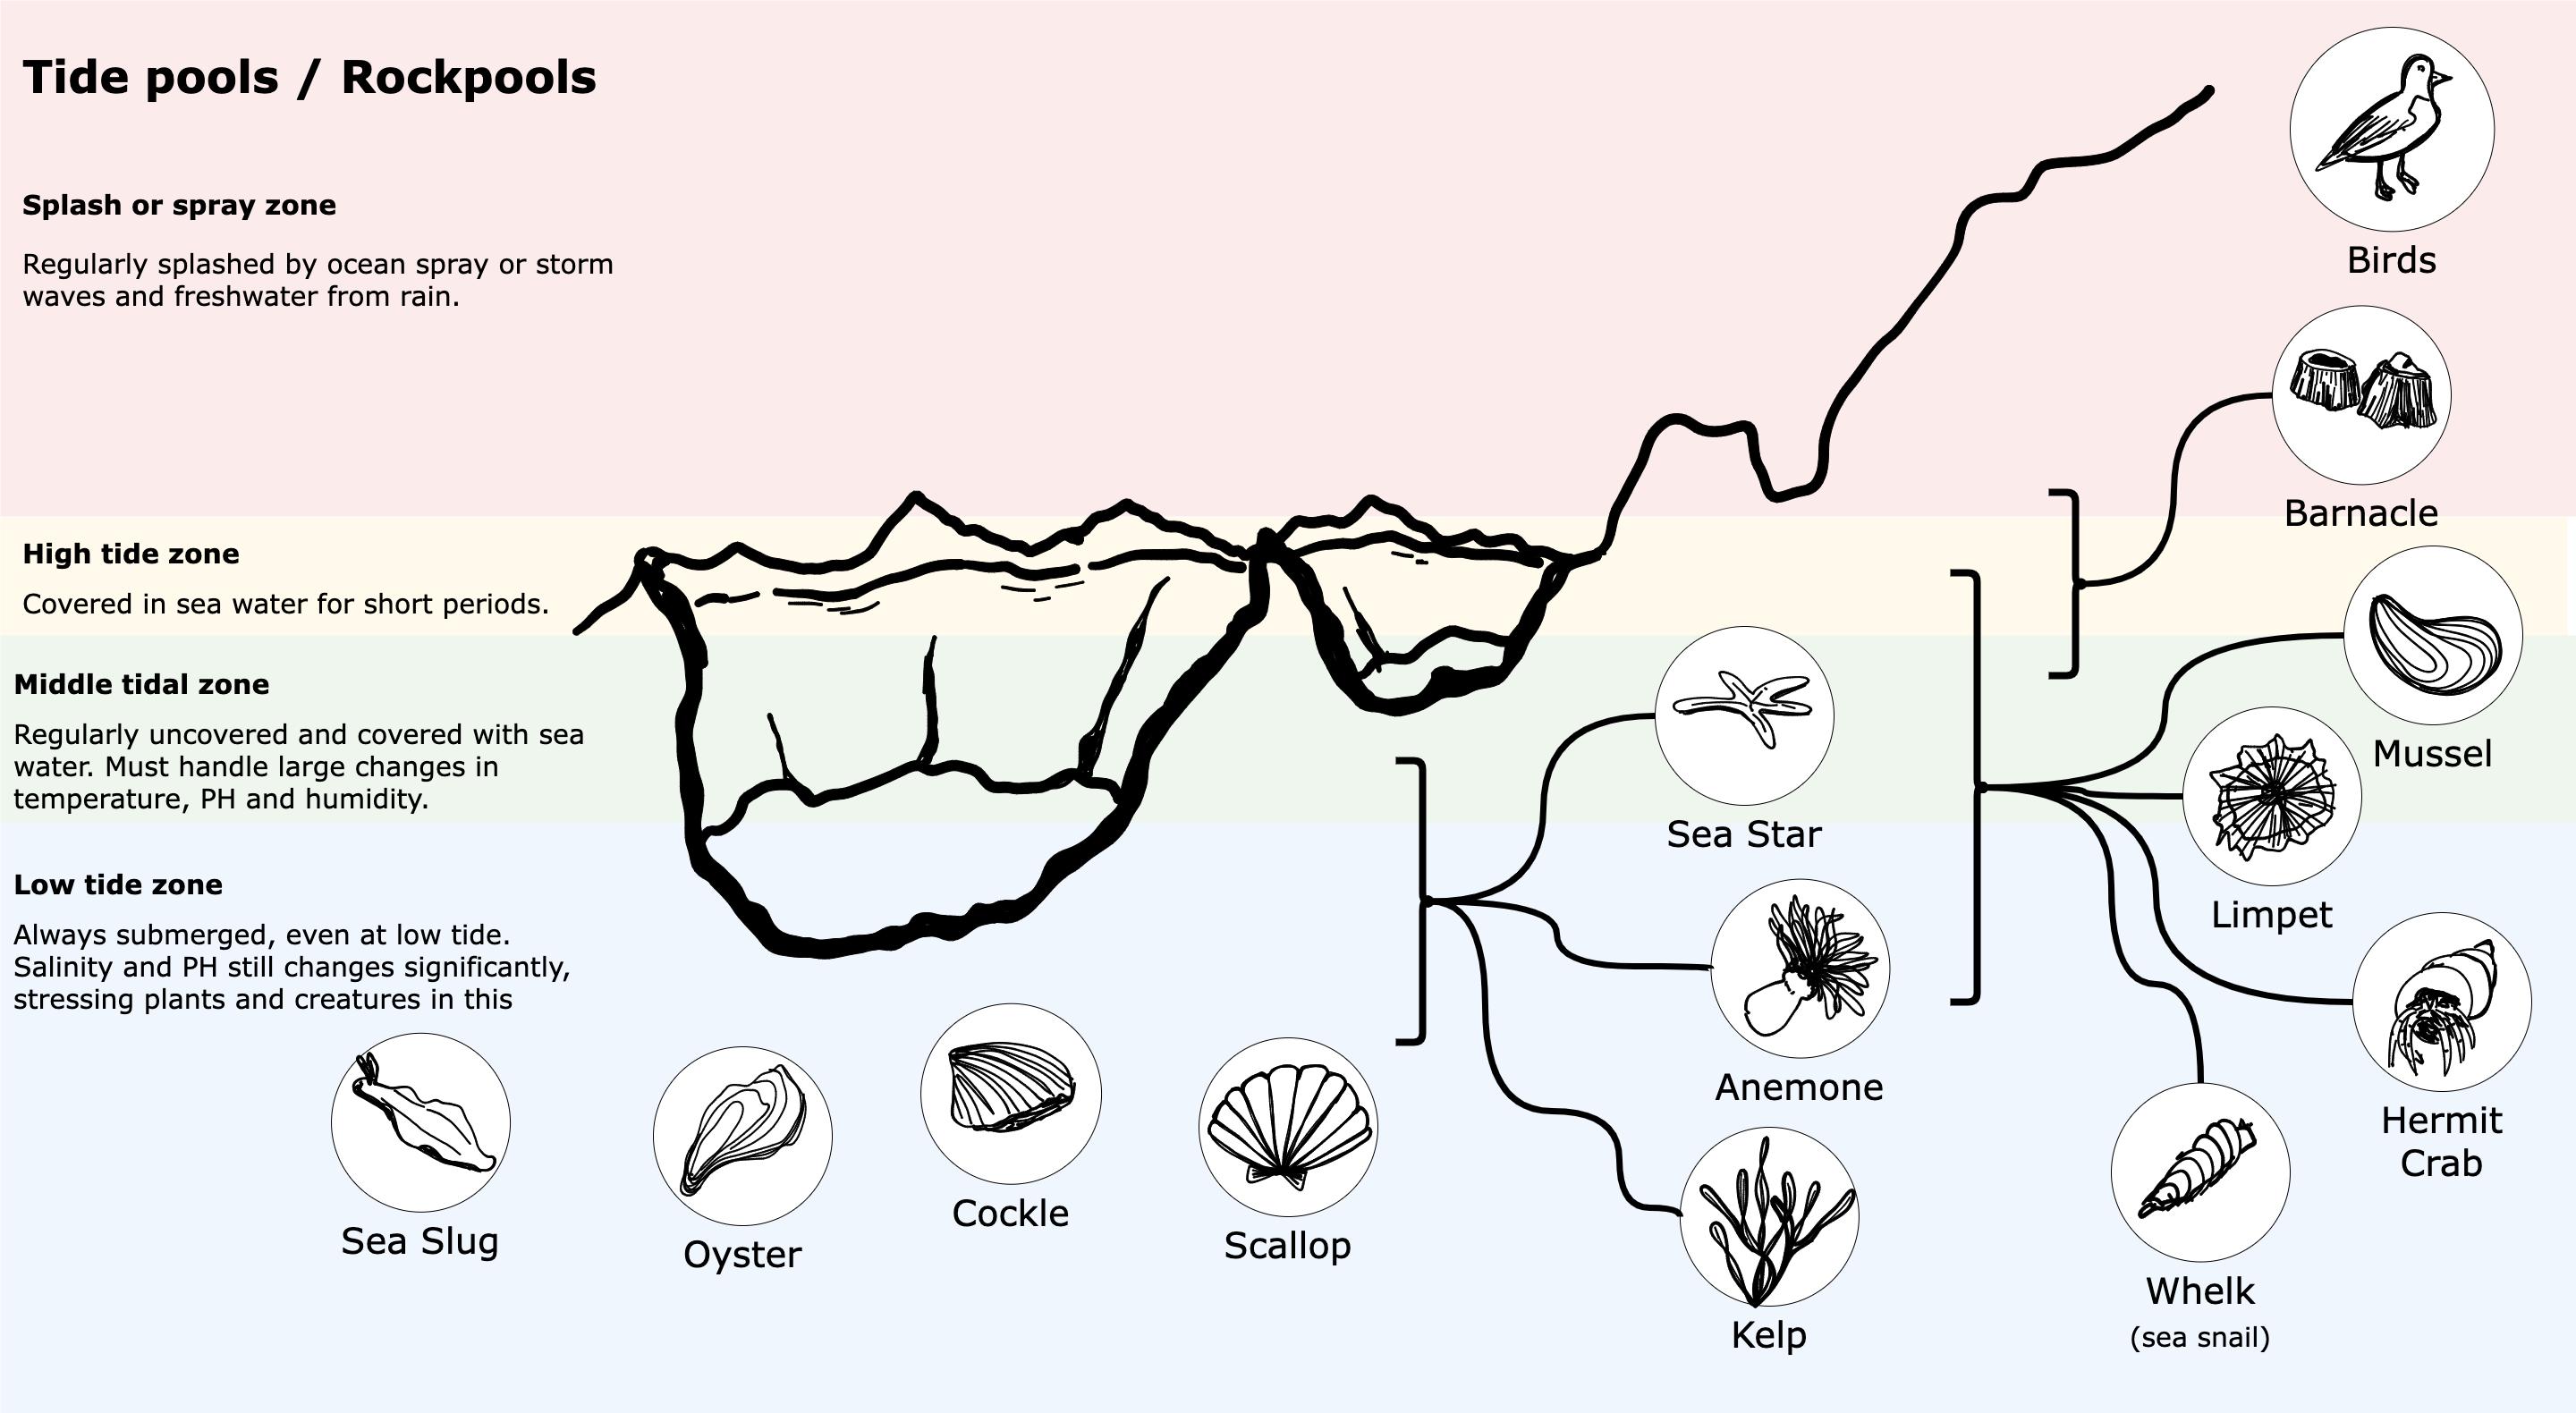
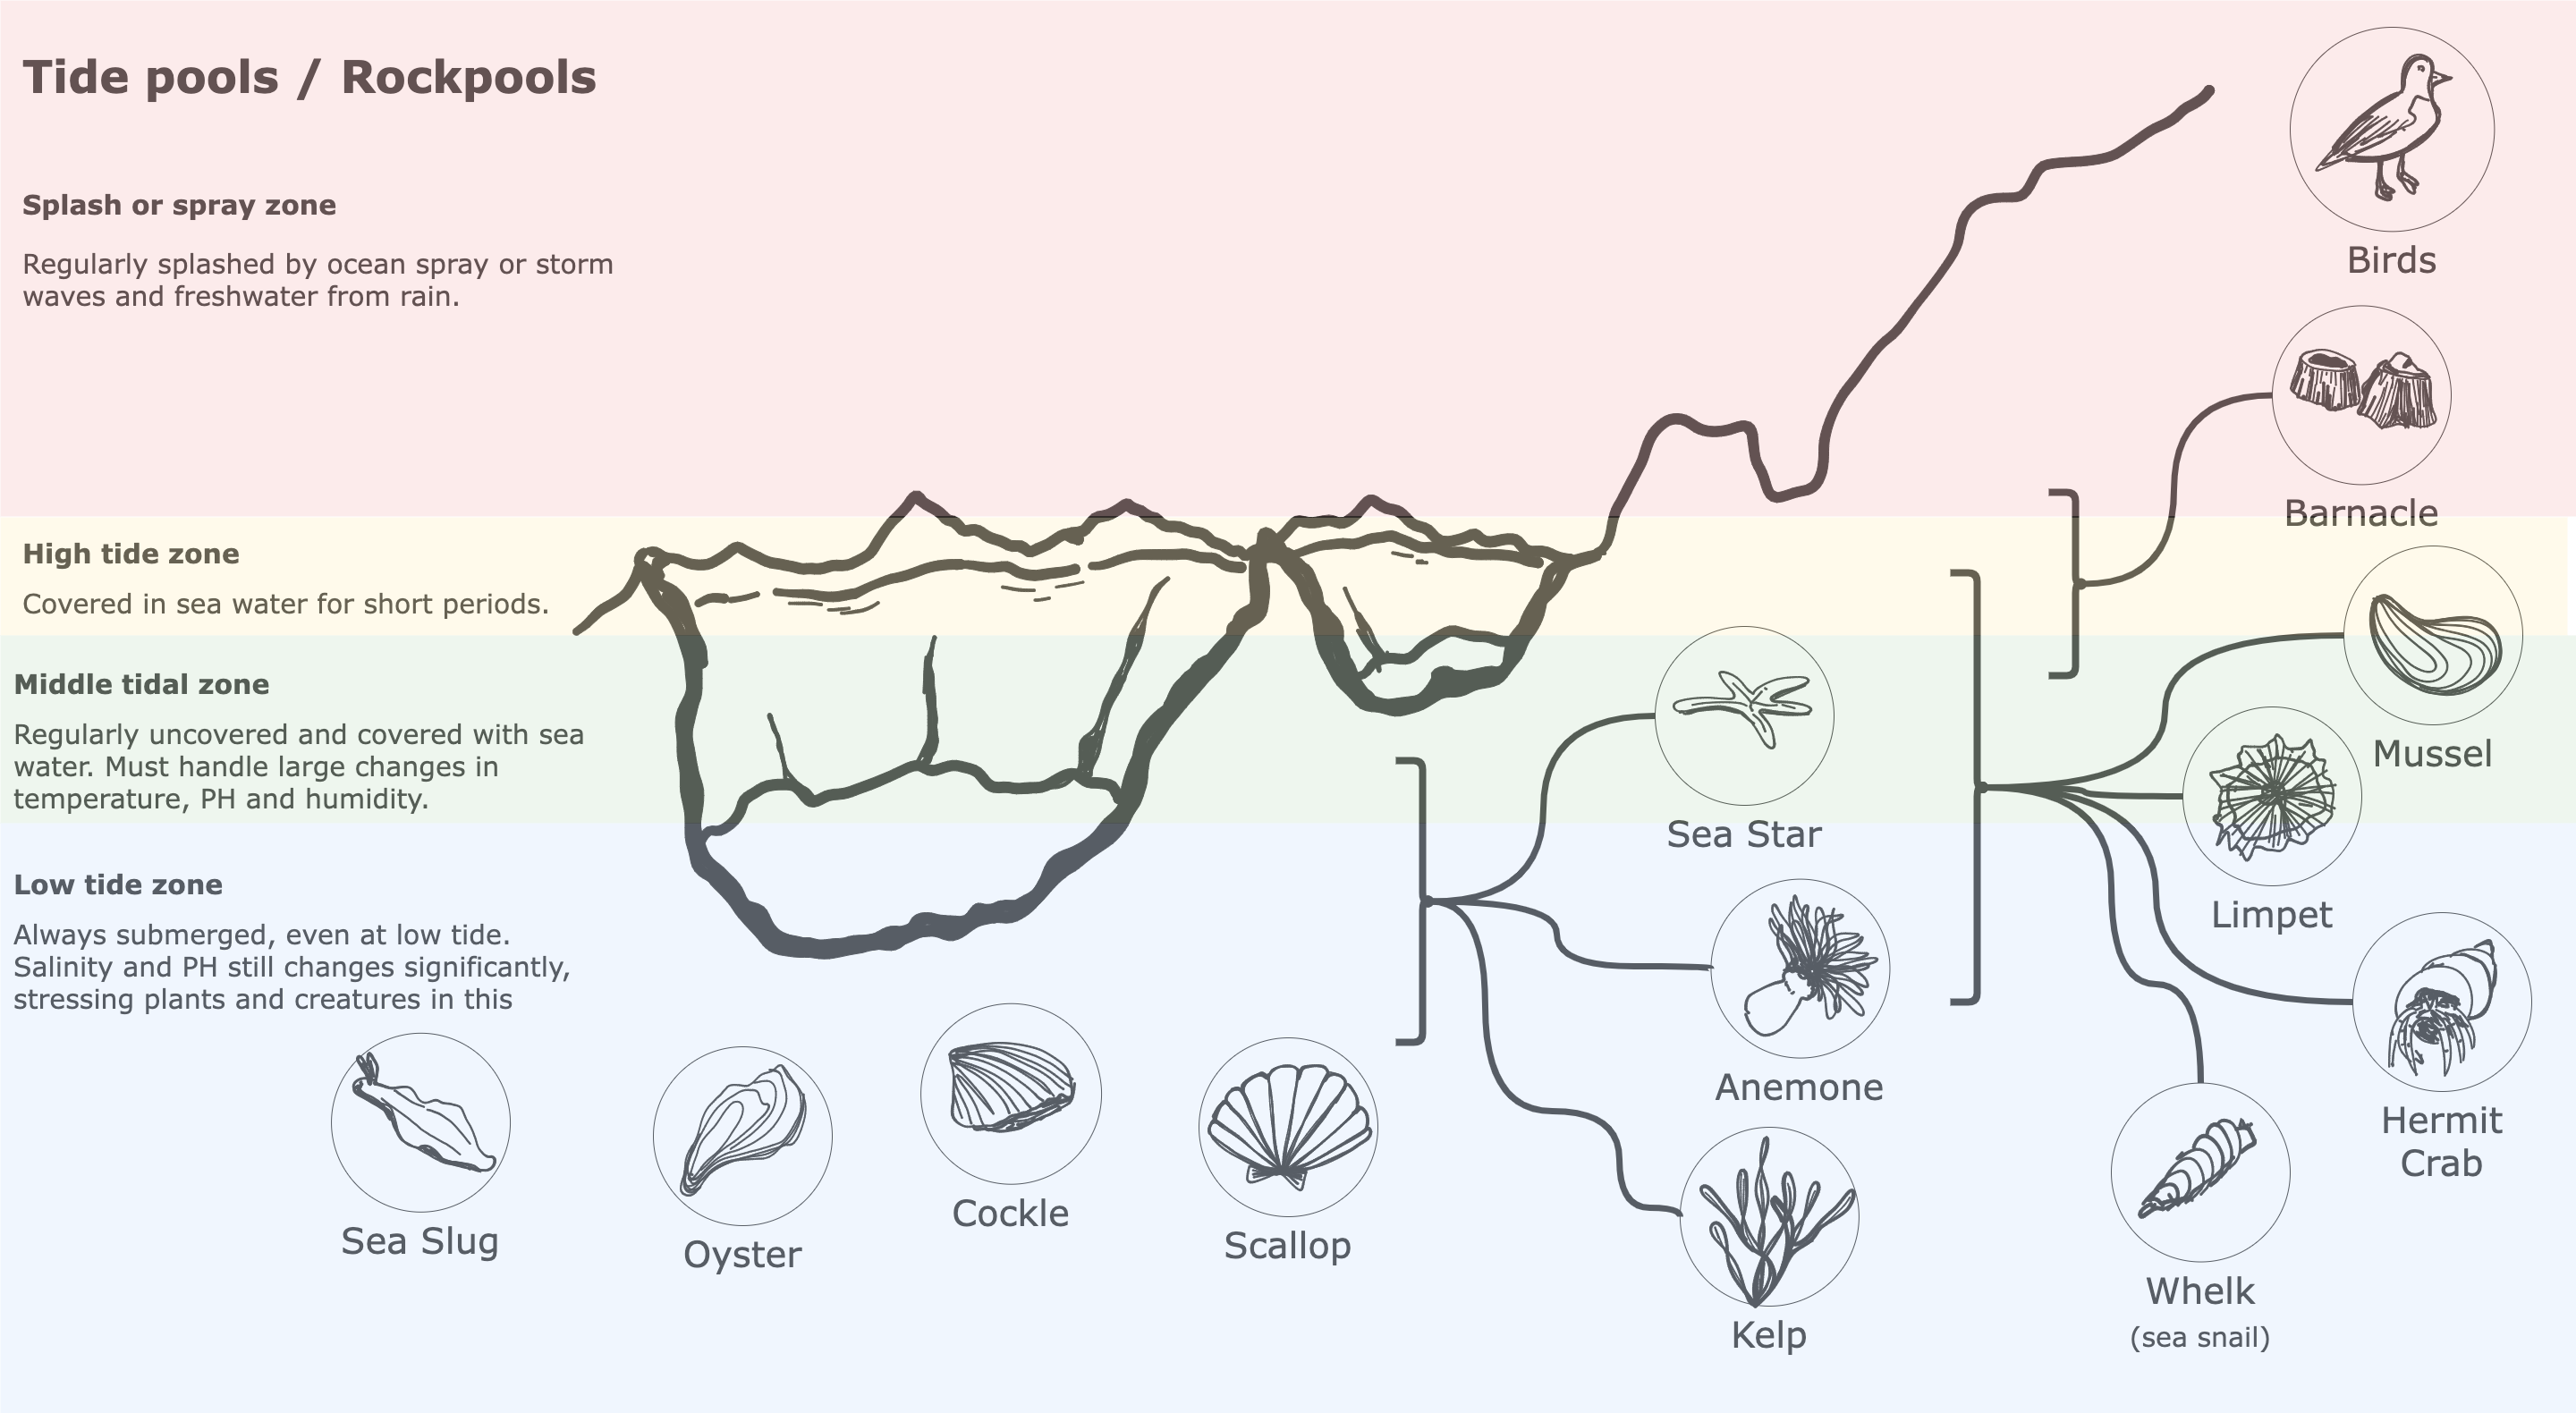
While the shape libraries in draw.io have a vast array of shapes for technical diagrams, there are relatively few illustrations for use in infographic diagrams. You can create your own illustration shapes easily using draw.io on a tablet. For example, all of the illustrations in this tidal pool infographic were drawn as freehand shapes in draw.io.
Draw a freehand shape
In simple mode, click on the freehand tool in the toolbar. In the classic editor, select Arrange > Insert > Freehand from the menu to open the freehand tool.
- Vary the width of the brush using the slider.
- Click Stop Drawing in the Freehand tool if you need to move the drawing canvas, zoom in or out, or move individual strokes without making new marks.
- Click Start Drawing to draw some more.
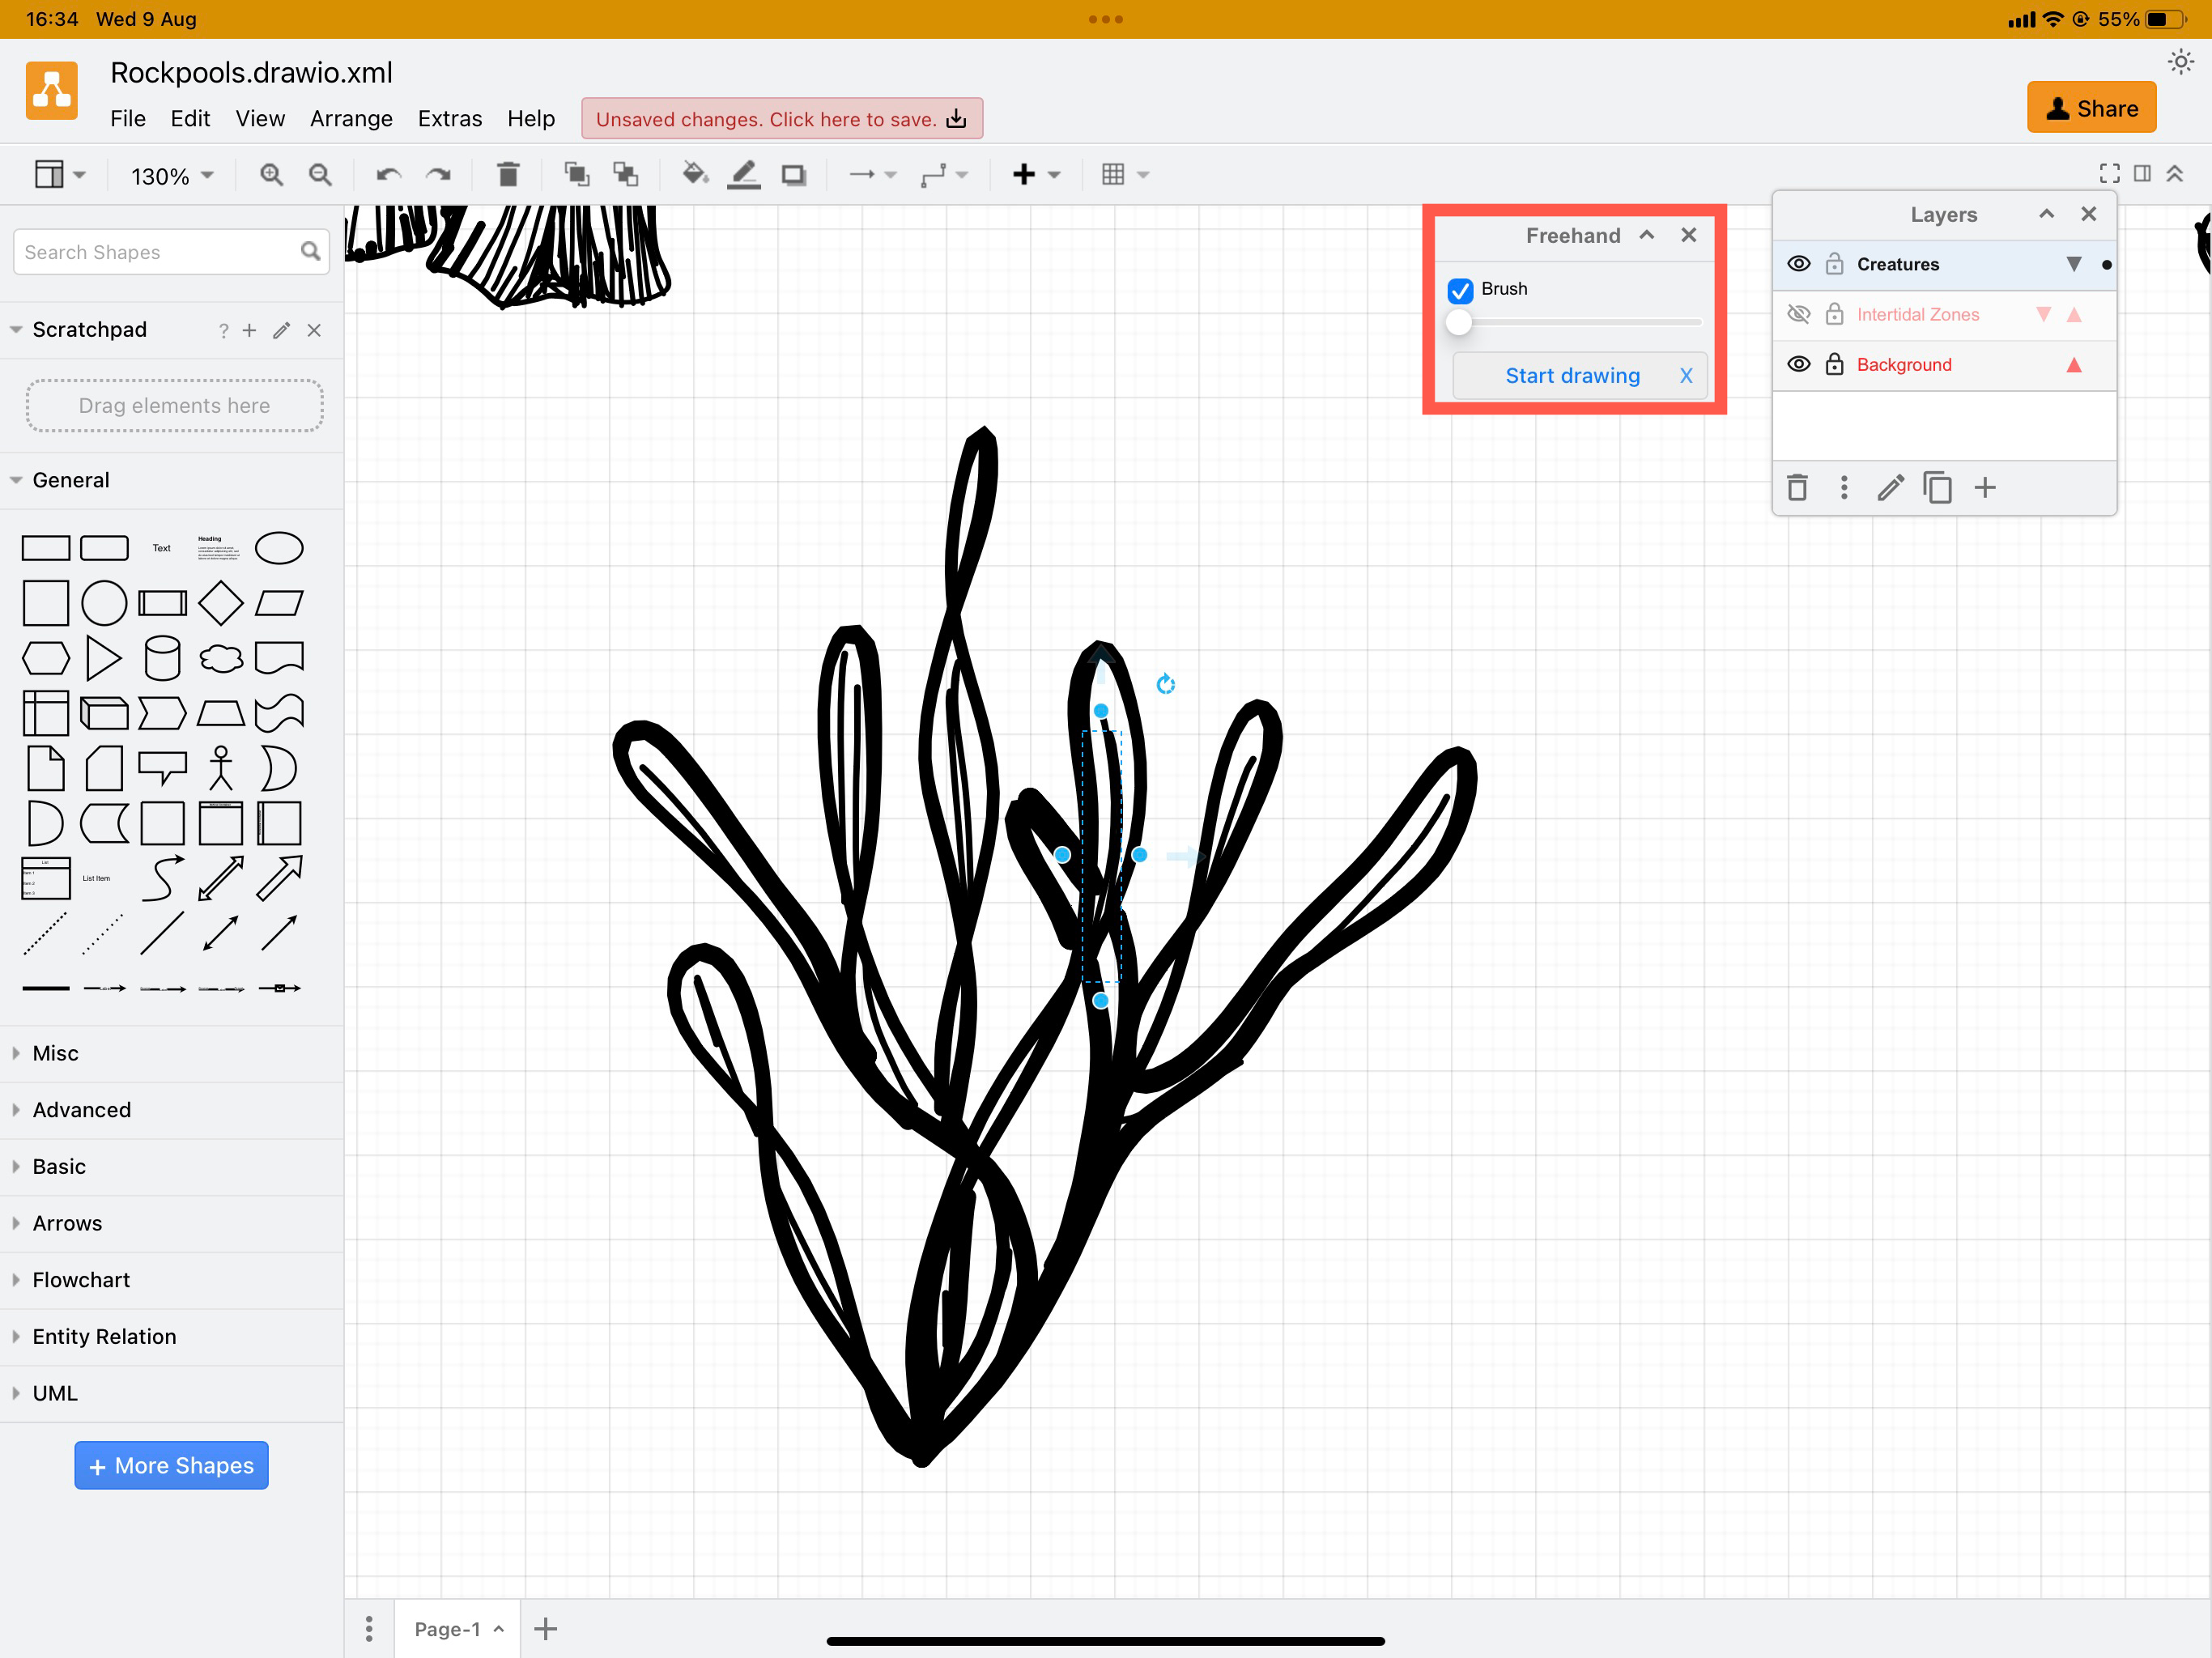
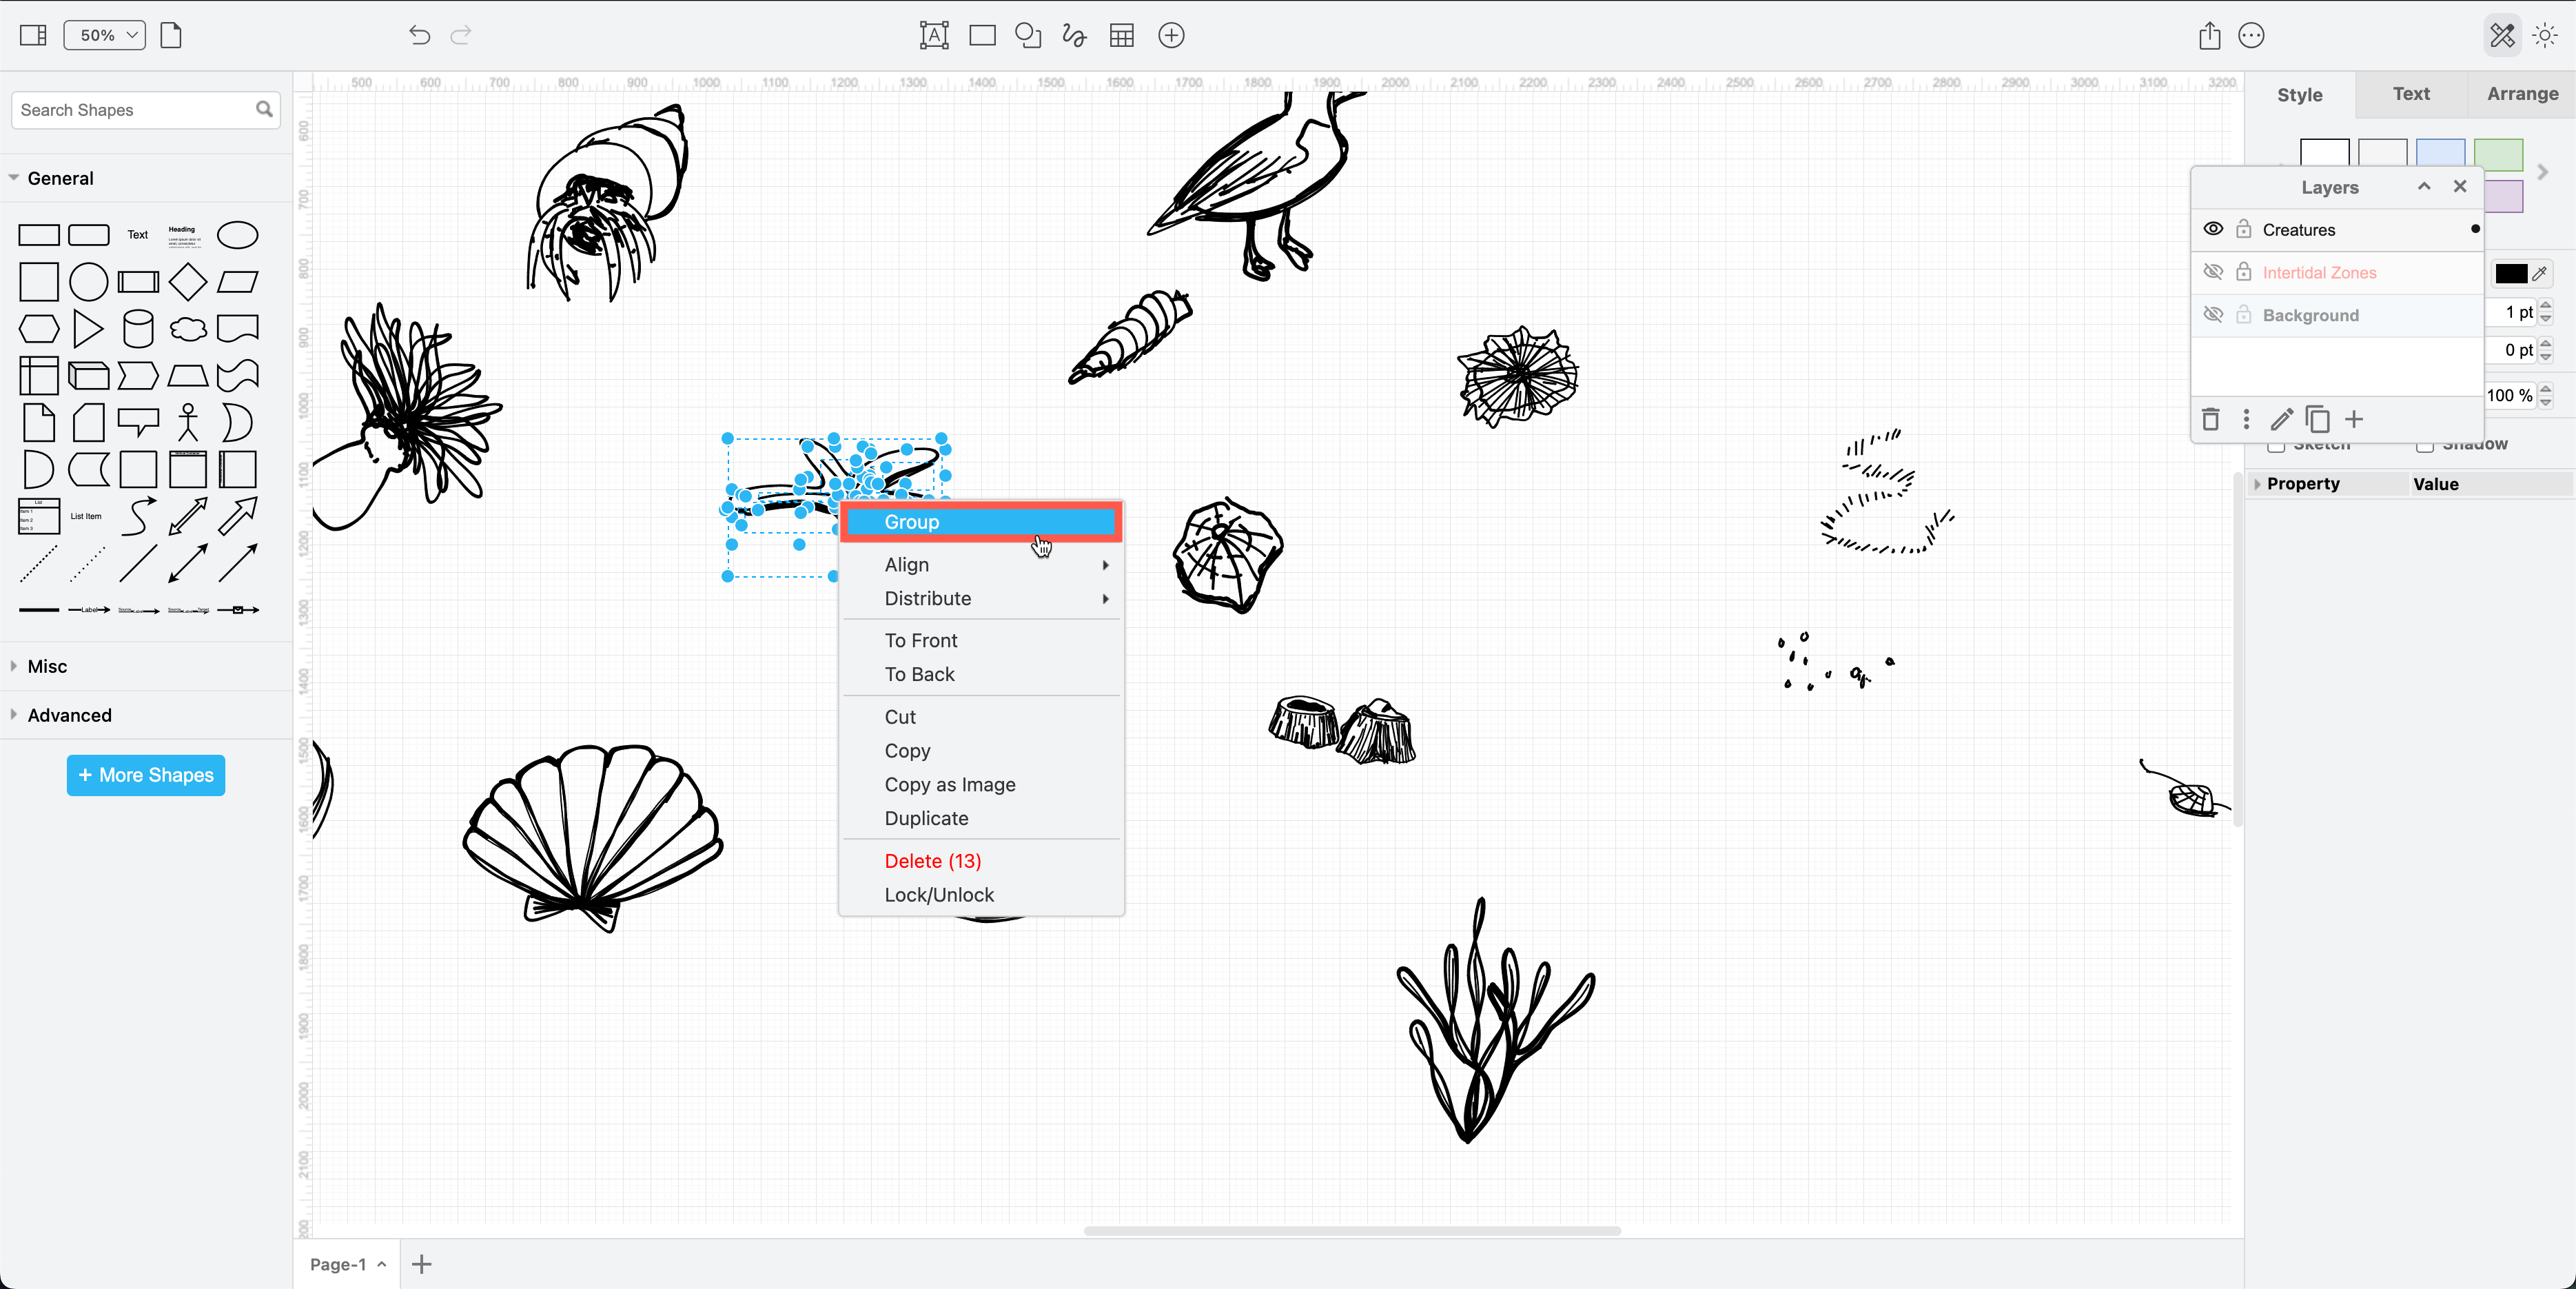
Once you have drawn your freehand shape, group all of the lines you drew so they stay together.
This is faster done on a computer using keyboard shortcuts (Ctrl+G or Cmd+G) or right-clicking on the selected shapes and choose Group from the context menu.
Learn more about the freehand drawing tool
Build a freehand shape library
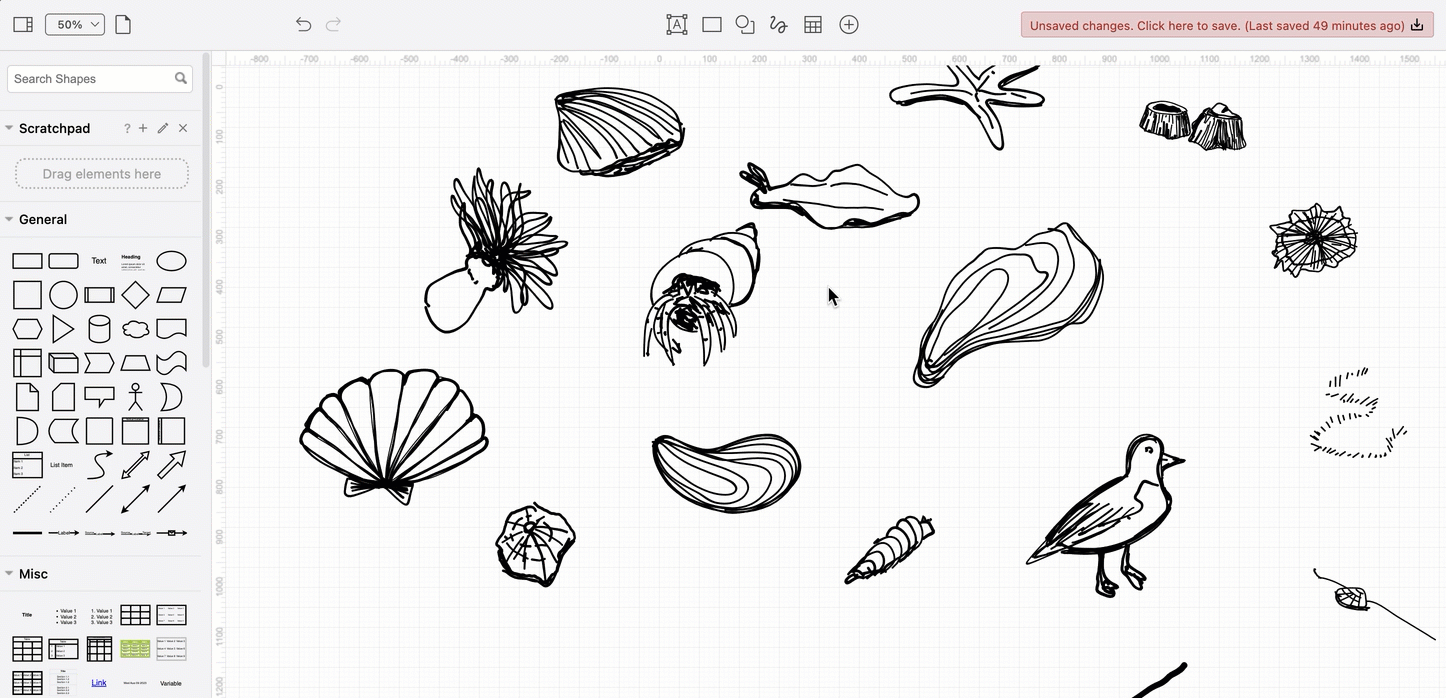
You can drag shapes into the scratchpad, including any that you have drawn, making it easy to reuse shapes in multiple diagrams.
Adding components from the shape libraries
When you drag a shape from the shape library over your freehand shape (that has been previously grouped), you’ll see the outline turn purple.
- Drop the new shape over the top while the outline is purple to add to the front of the group.
- Send this shape to the back via the Arrange tab of the format panel.
In this infographic example, each freehand creature will be placed inside a circle to improve readability in the final infographic.
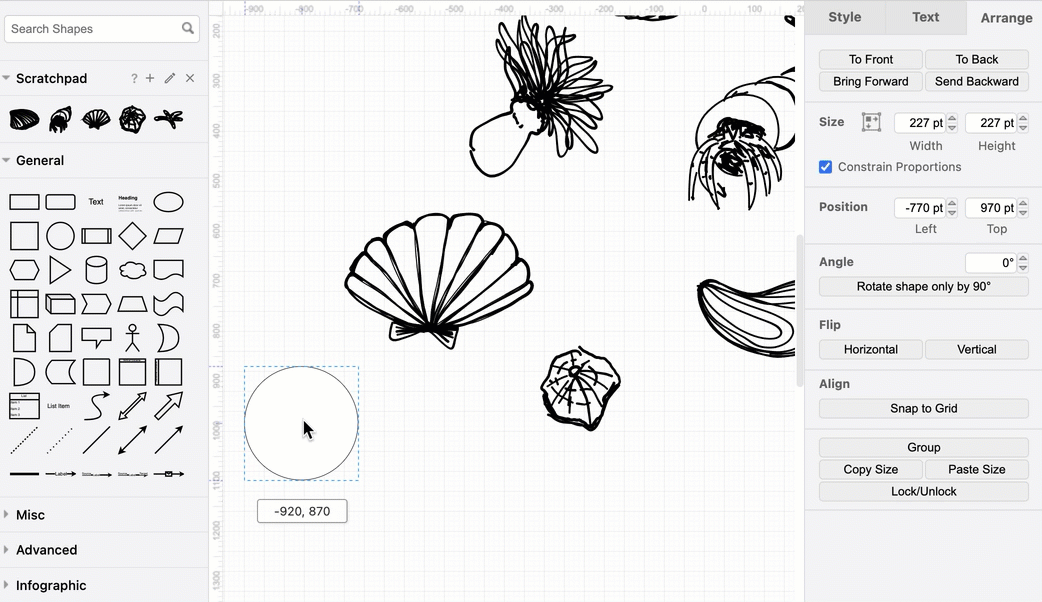
You can download the freehand rockpool shapes custom library from our drawio-diagrams repository on GitHub.
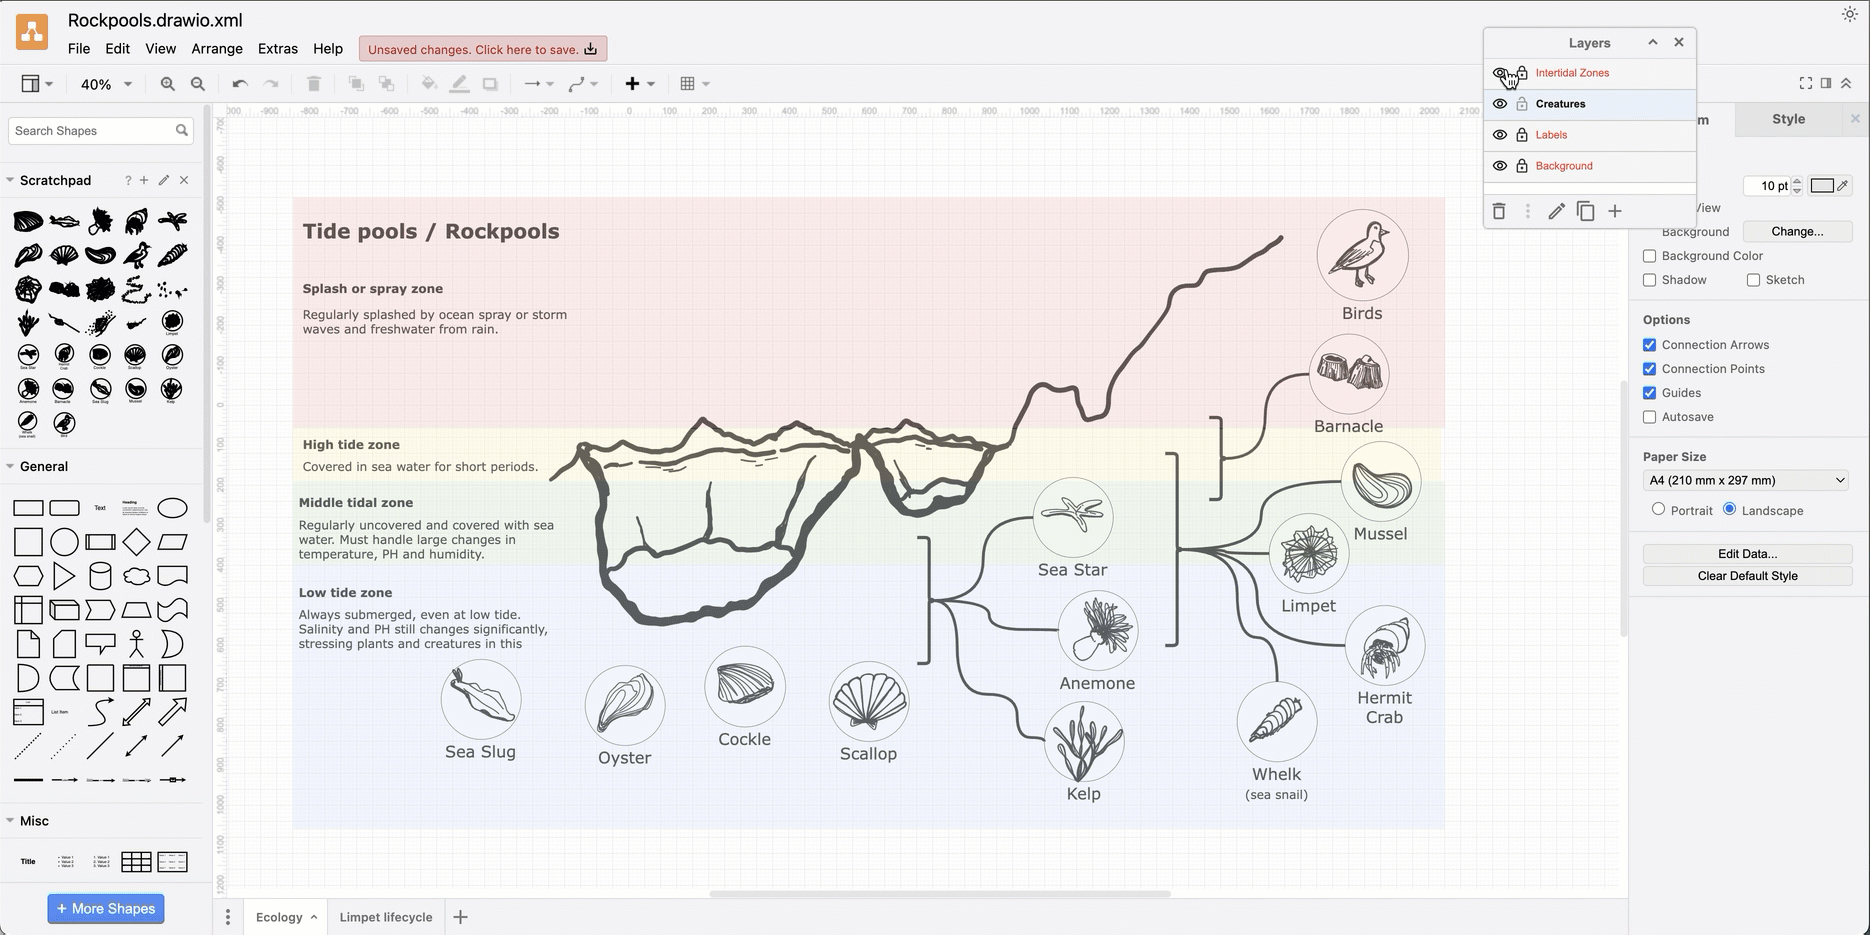
Use layers to organise your infographic
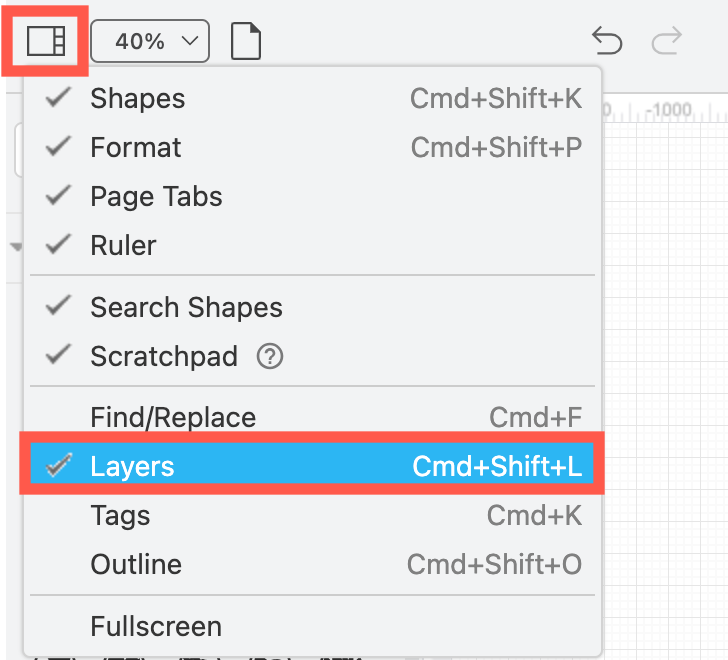
Click on the View tool in the top left of the toolbar and select Layers or press Ctrl+Shift+L to open the Layers dialog.
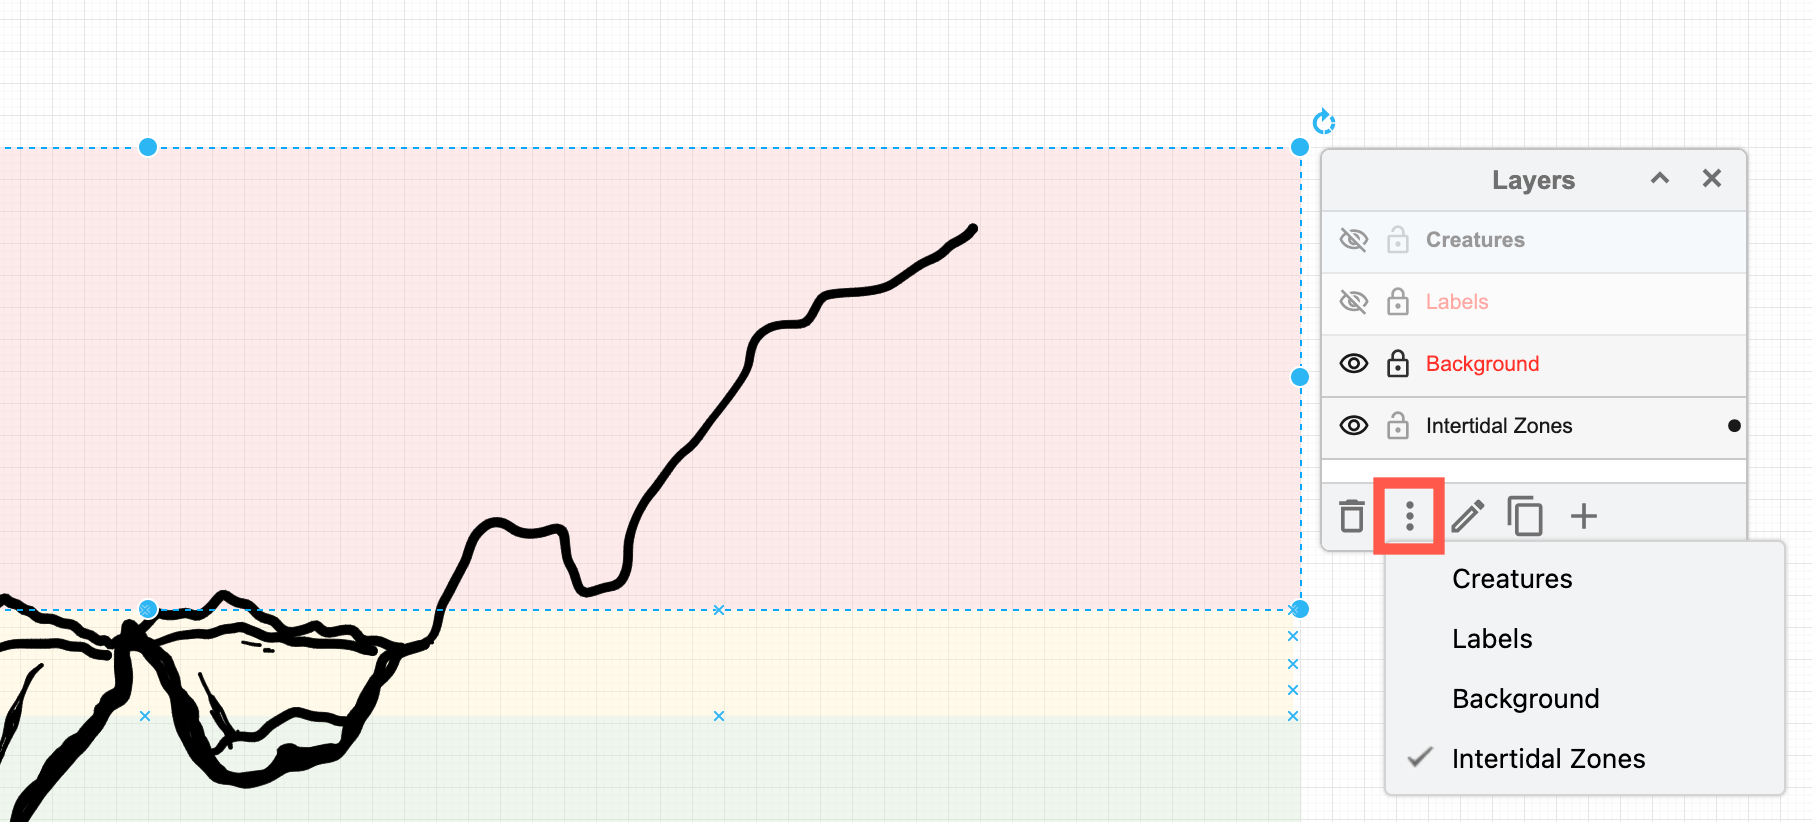
In this example, we’ll use four layers:
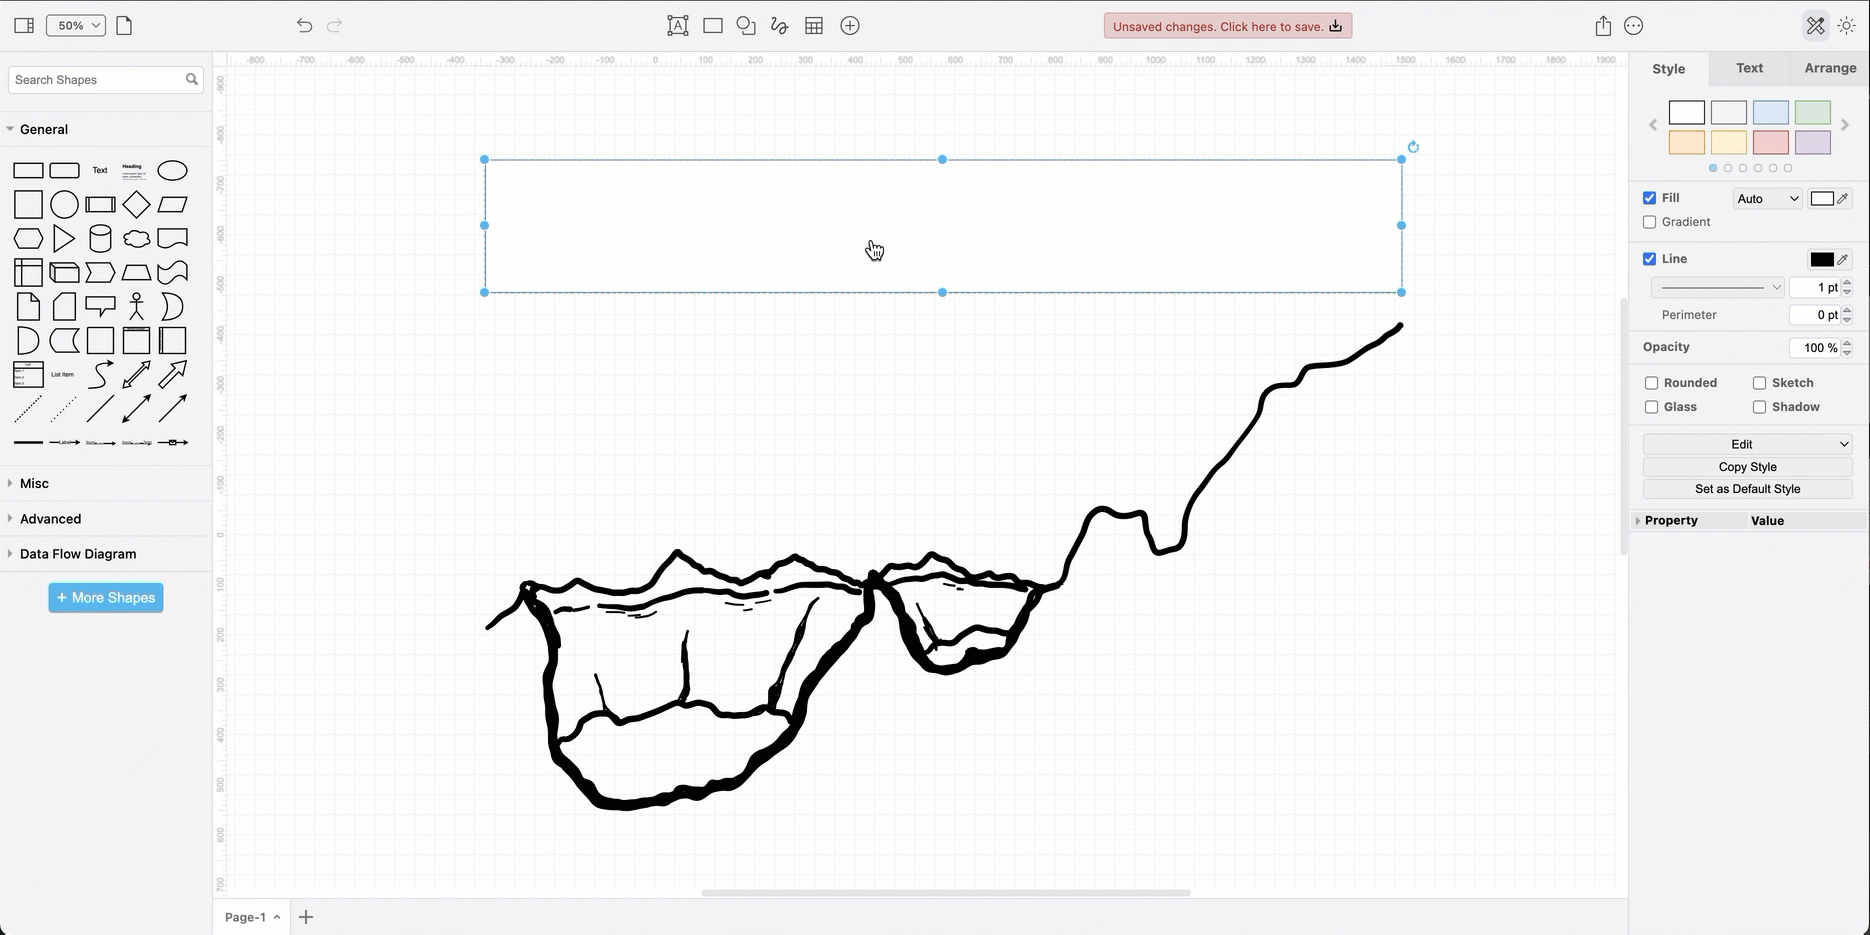
- A background layer for the cutaway tidal pool freehand shape.
- A creature layer.
- A label layer to explain the different zones in the tidal pool.
- A layer to add a colour wash to show the different intertidal zones.
Click + to add a layer and double click on the layer name to rename it.
When you select a shape, you’ll see a dot next to the layer it is currently assigned. Move the selected shape from one layer to another via the vertical dots (Move selection to) and selecting a different layer.
It’s easier to build your infographic layer by layer - click the eye icon next to any layer to hide it from view. Then you won’t accidentally add shapes to that layer.
To lock a layer and ensure the shapes on that layer can’t be selected, click the lock icon next to the layer name. Locked layers are clearly indicated in red.
Learn more about working with layers
Note If you don’t want to use layers, hold down Alt when you drop a shape over a grouped shape if you don’t want to add the new shape to the group.
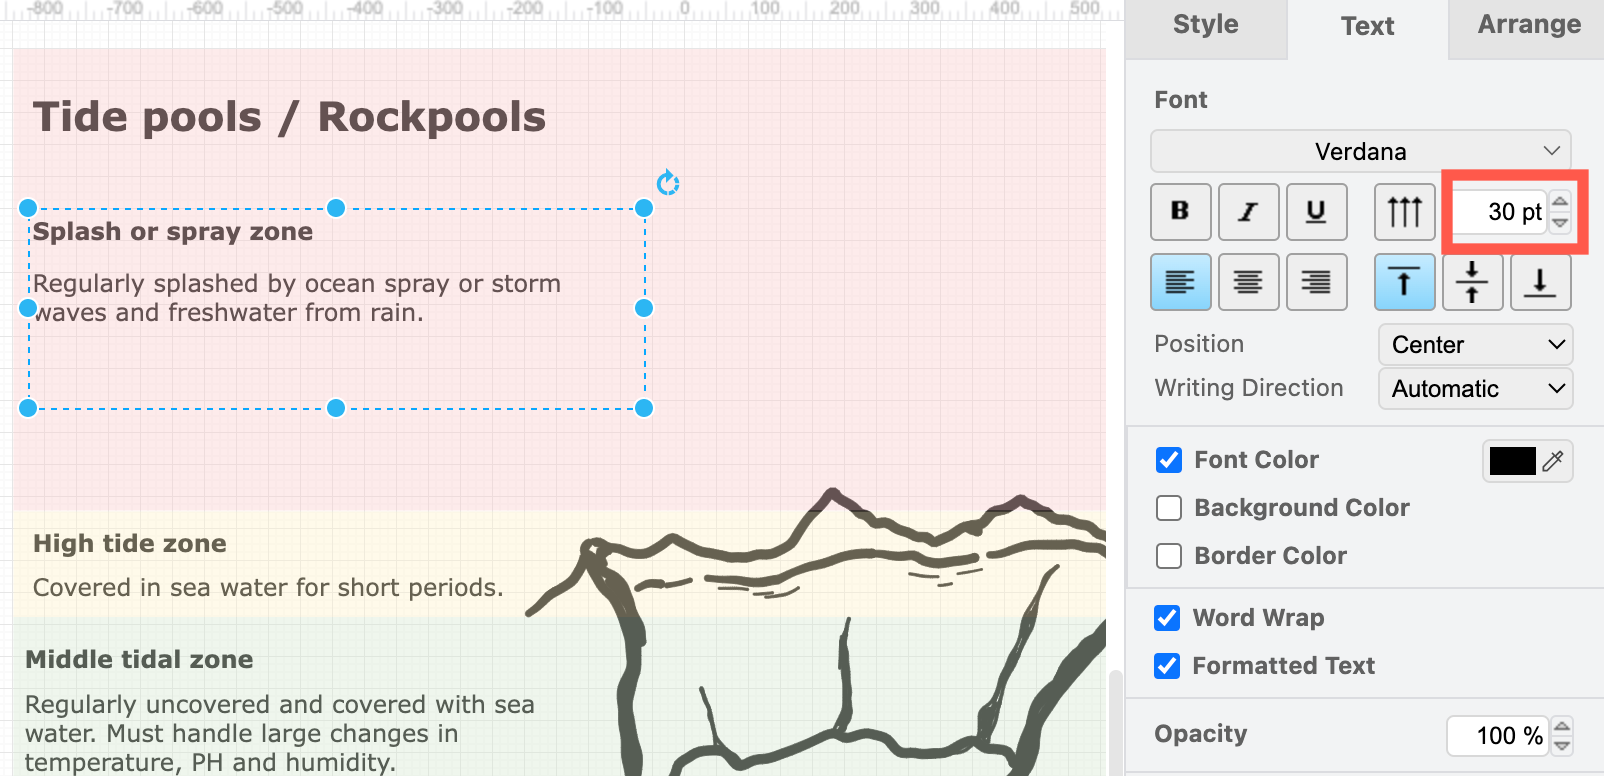
Add labels to your infographic
Use connectors to label the diagrams in your infographic, or link text components to the right locations. It’s best to keep text to a minimum so it doesn’t distract from the visualisation.
In this example, we’ve used the Right Curly Bracket shape from the Misc shape library (part of the General shape library) to show when creatures live in multiple zones in the tidal pool.
Make sure you format text labels so they are readable - change the font size and colours in the Text tab of the format panel.
You may need to change the order of the layers to improve readability. Our example is much clearer when the coloured layer is at the bottom of the diagram.
Open this rockpool infographic in draw.io online
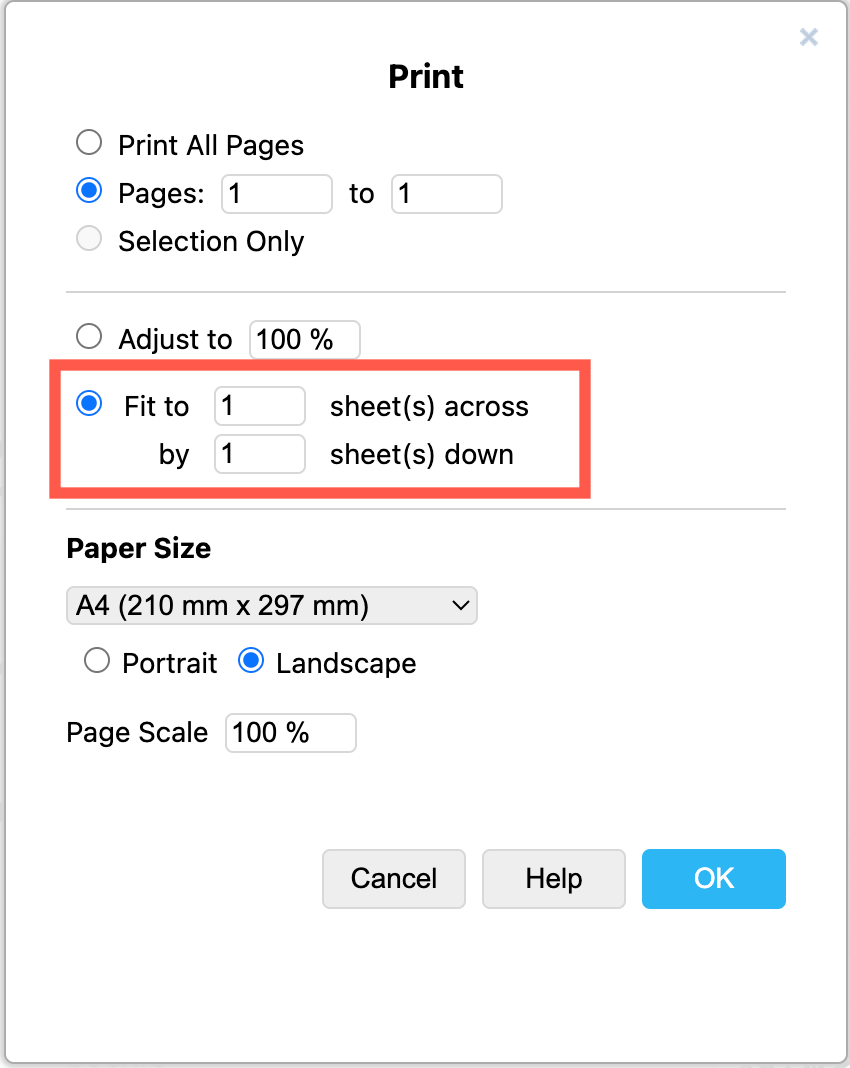
Save your infographic as an image or PDF
The final step is to save your infographic diagram into the format you need.
-
Open the draw.io menu and select Export As (or File > Export As) and choose PNG or SVG to export to an image format and ensure all text remains readable if the image is resized when you embed it into another document or webpage.
-
Alternatively export to a PDF or print and save this as a PDF. Make sure you fit the diagram to the correct number of pages in the Print dialog.
Alternative - modify a template or infographic shape
There are several examples of infographics in both the draw.io template library and the Infographic shape library that you can modify for your infographic.
-
Open the template library via the toolbar (click + then select Template) or via the menu (_Arrange > Insert > Template).
-
Click on More Shapes in the shape panel on the left and enable the Infographic shape library.
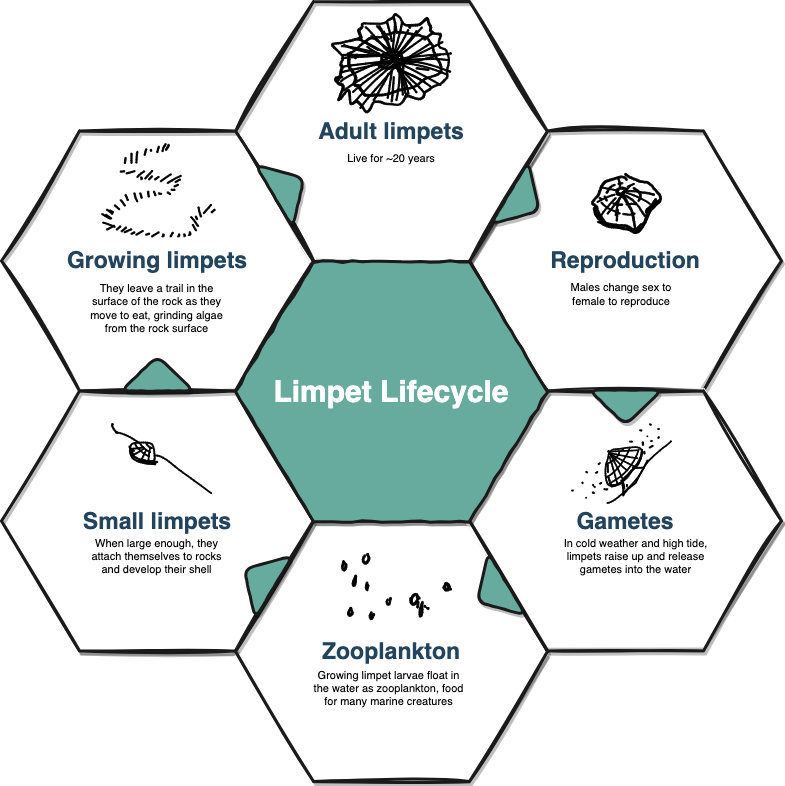
For example, the Food Cycle template in the Other category in the template library, is easily modified to show the lifecycle of a limpet.
Tip: See our drawio-diagrams GitHub repository for more templates and example diagrams.