Explain system roles and responsibilities in diagrams
There are many systems where you need to describe the different roles that interact with it, and what their responsibilities are. As they can be quite complex, diagrams help you to explain how it works to both customers and colleagues.
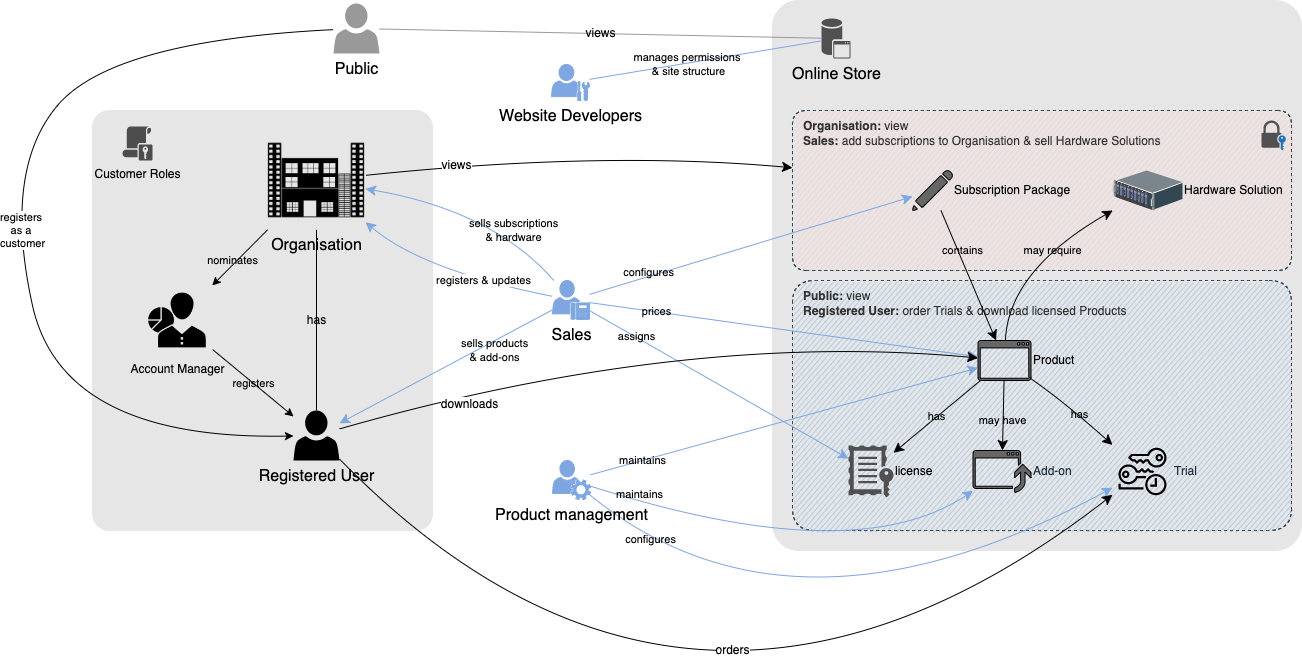
For example, you could visualise an online store selling applications in any number of common diagram types - UML use case diagrams, entity relationships, activity diagrams, infrastructure models - but none of these would concisely convey to the staff and customers that use the system what they are responsible for.
Responsibility-driven design
There are no existing specifications to follow to diagram roles and responsibilities, unlike as with UML or SysML diagrams.
As this diagram shows how parts of a system and its users relate to each other, it would fall under the broad umbrella category of relationship diagrams.
In responsibility-driven design, there is a higher level of abstraction - you don’t need to consider the programming language, any infrastructure specifics, or interface and database details.
Where to use such a role and responsibility diagram
Diagrams that visualise how different user groups are supposed to use each part of a system are typically used in internal training material to get new colleagues or teams up to speed quickly.
They are also useful for onboarding customer groups where different customer roles have different levels of access to your system.
Drawing roles and responsibilities
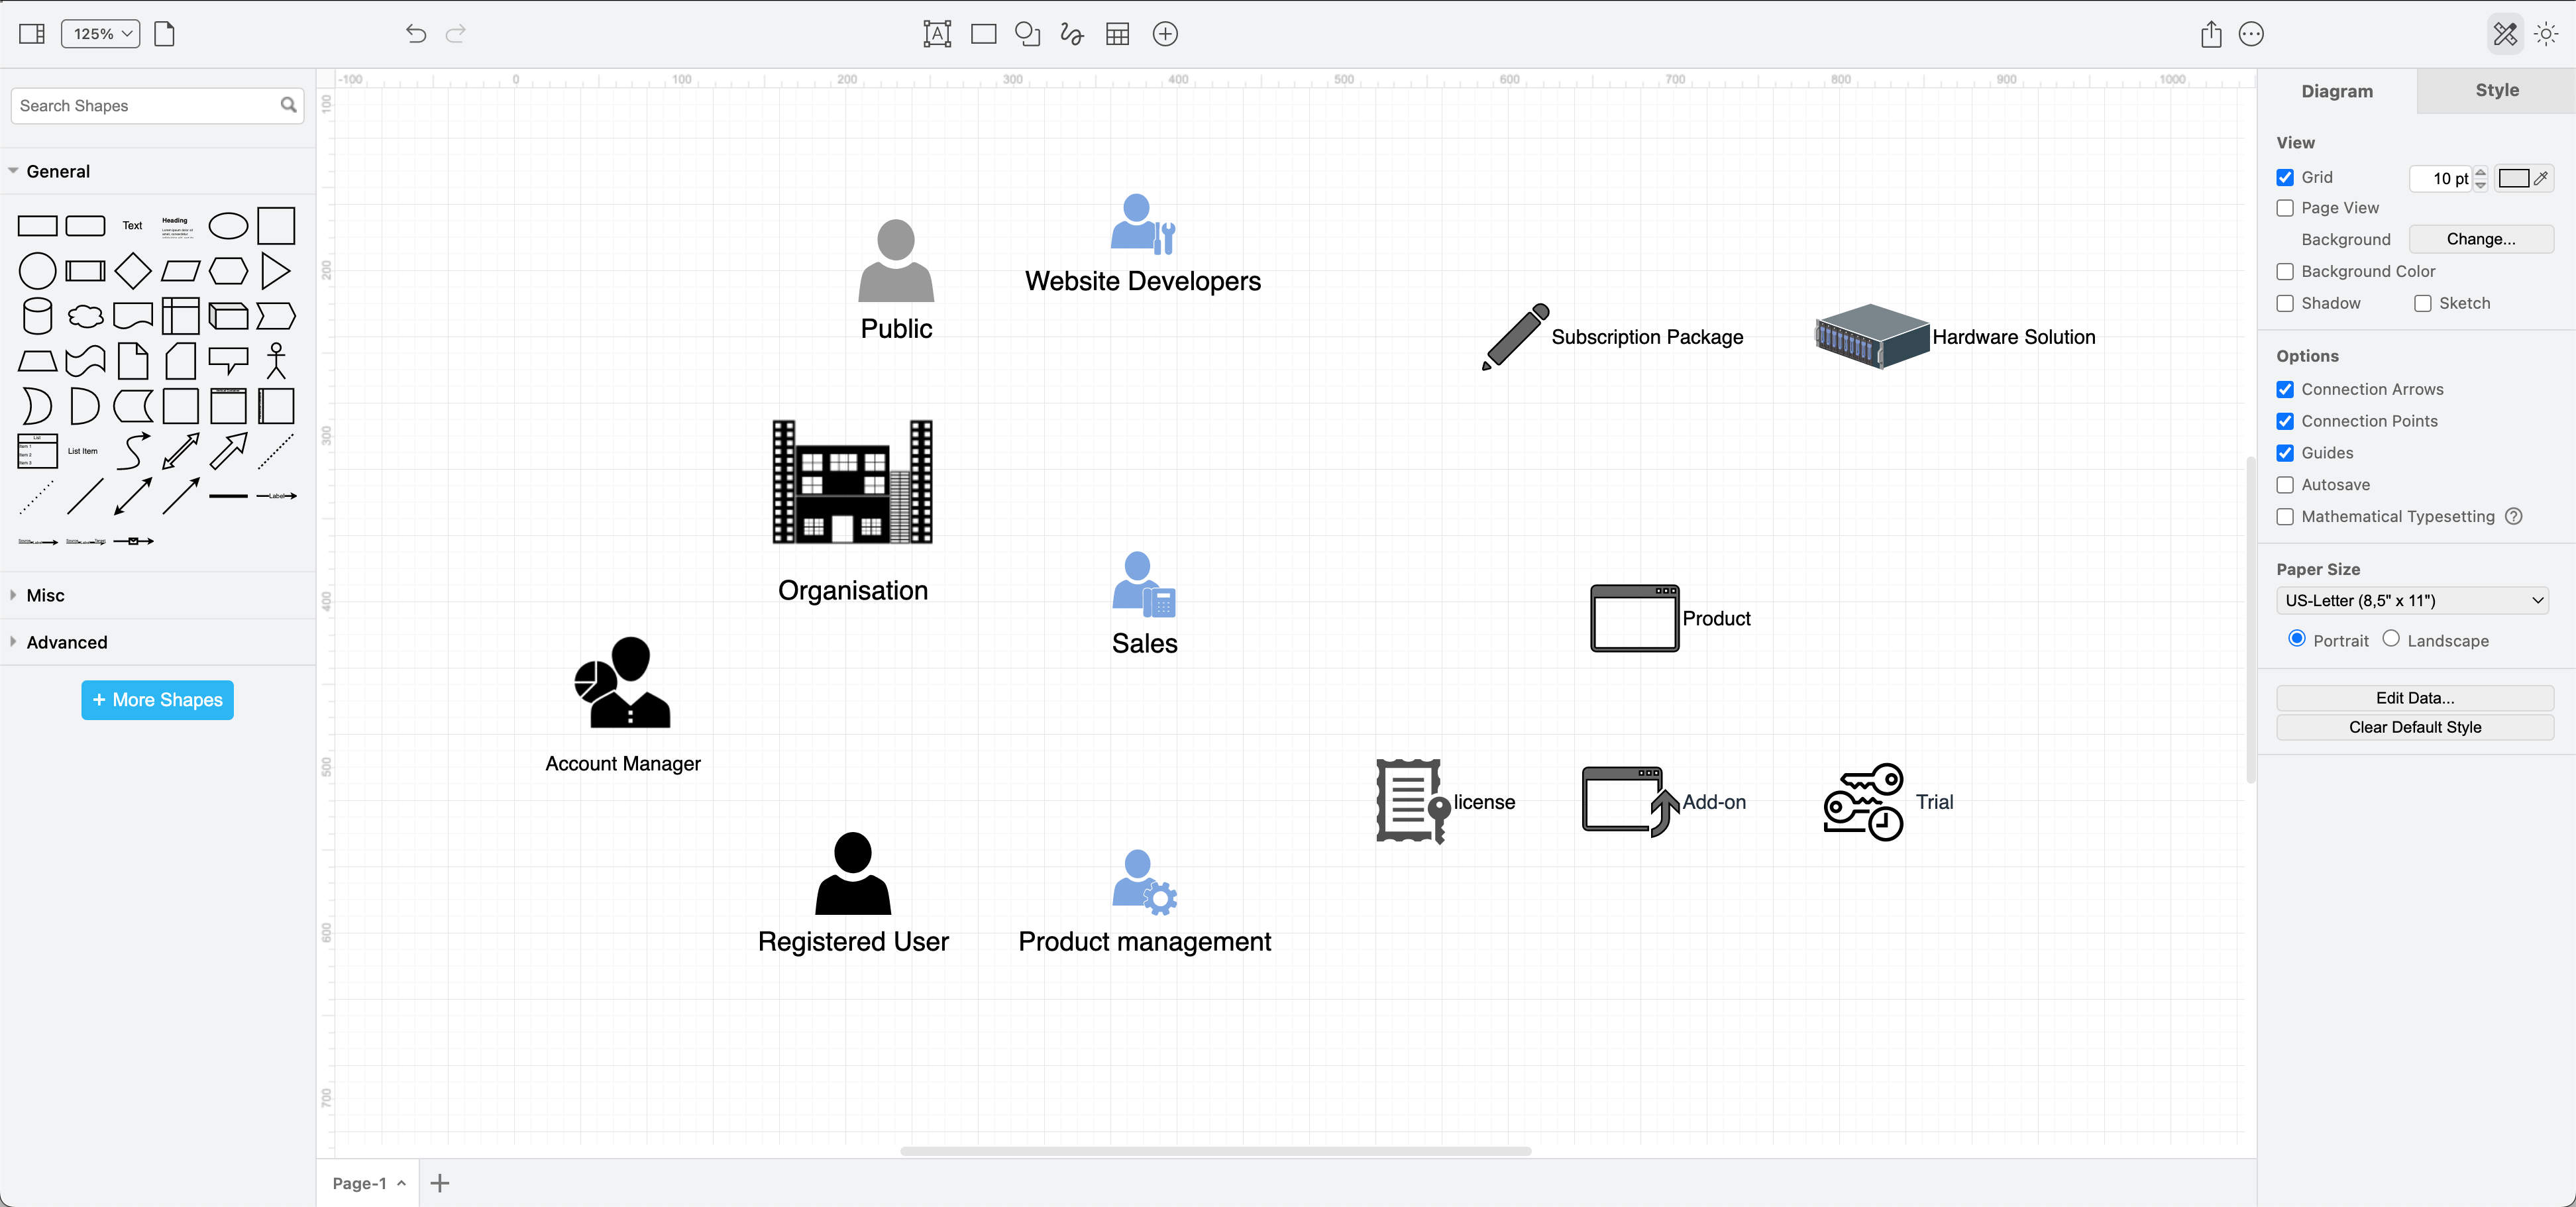
First, add the objects to represent the various parts of the system, and then the user roles using basic shapes or clipart to better describe those elements.
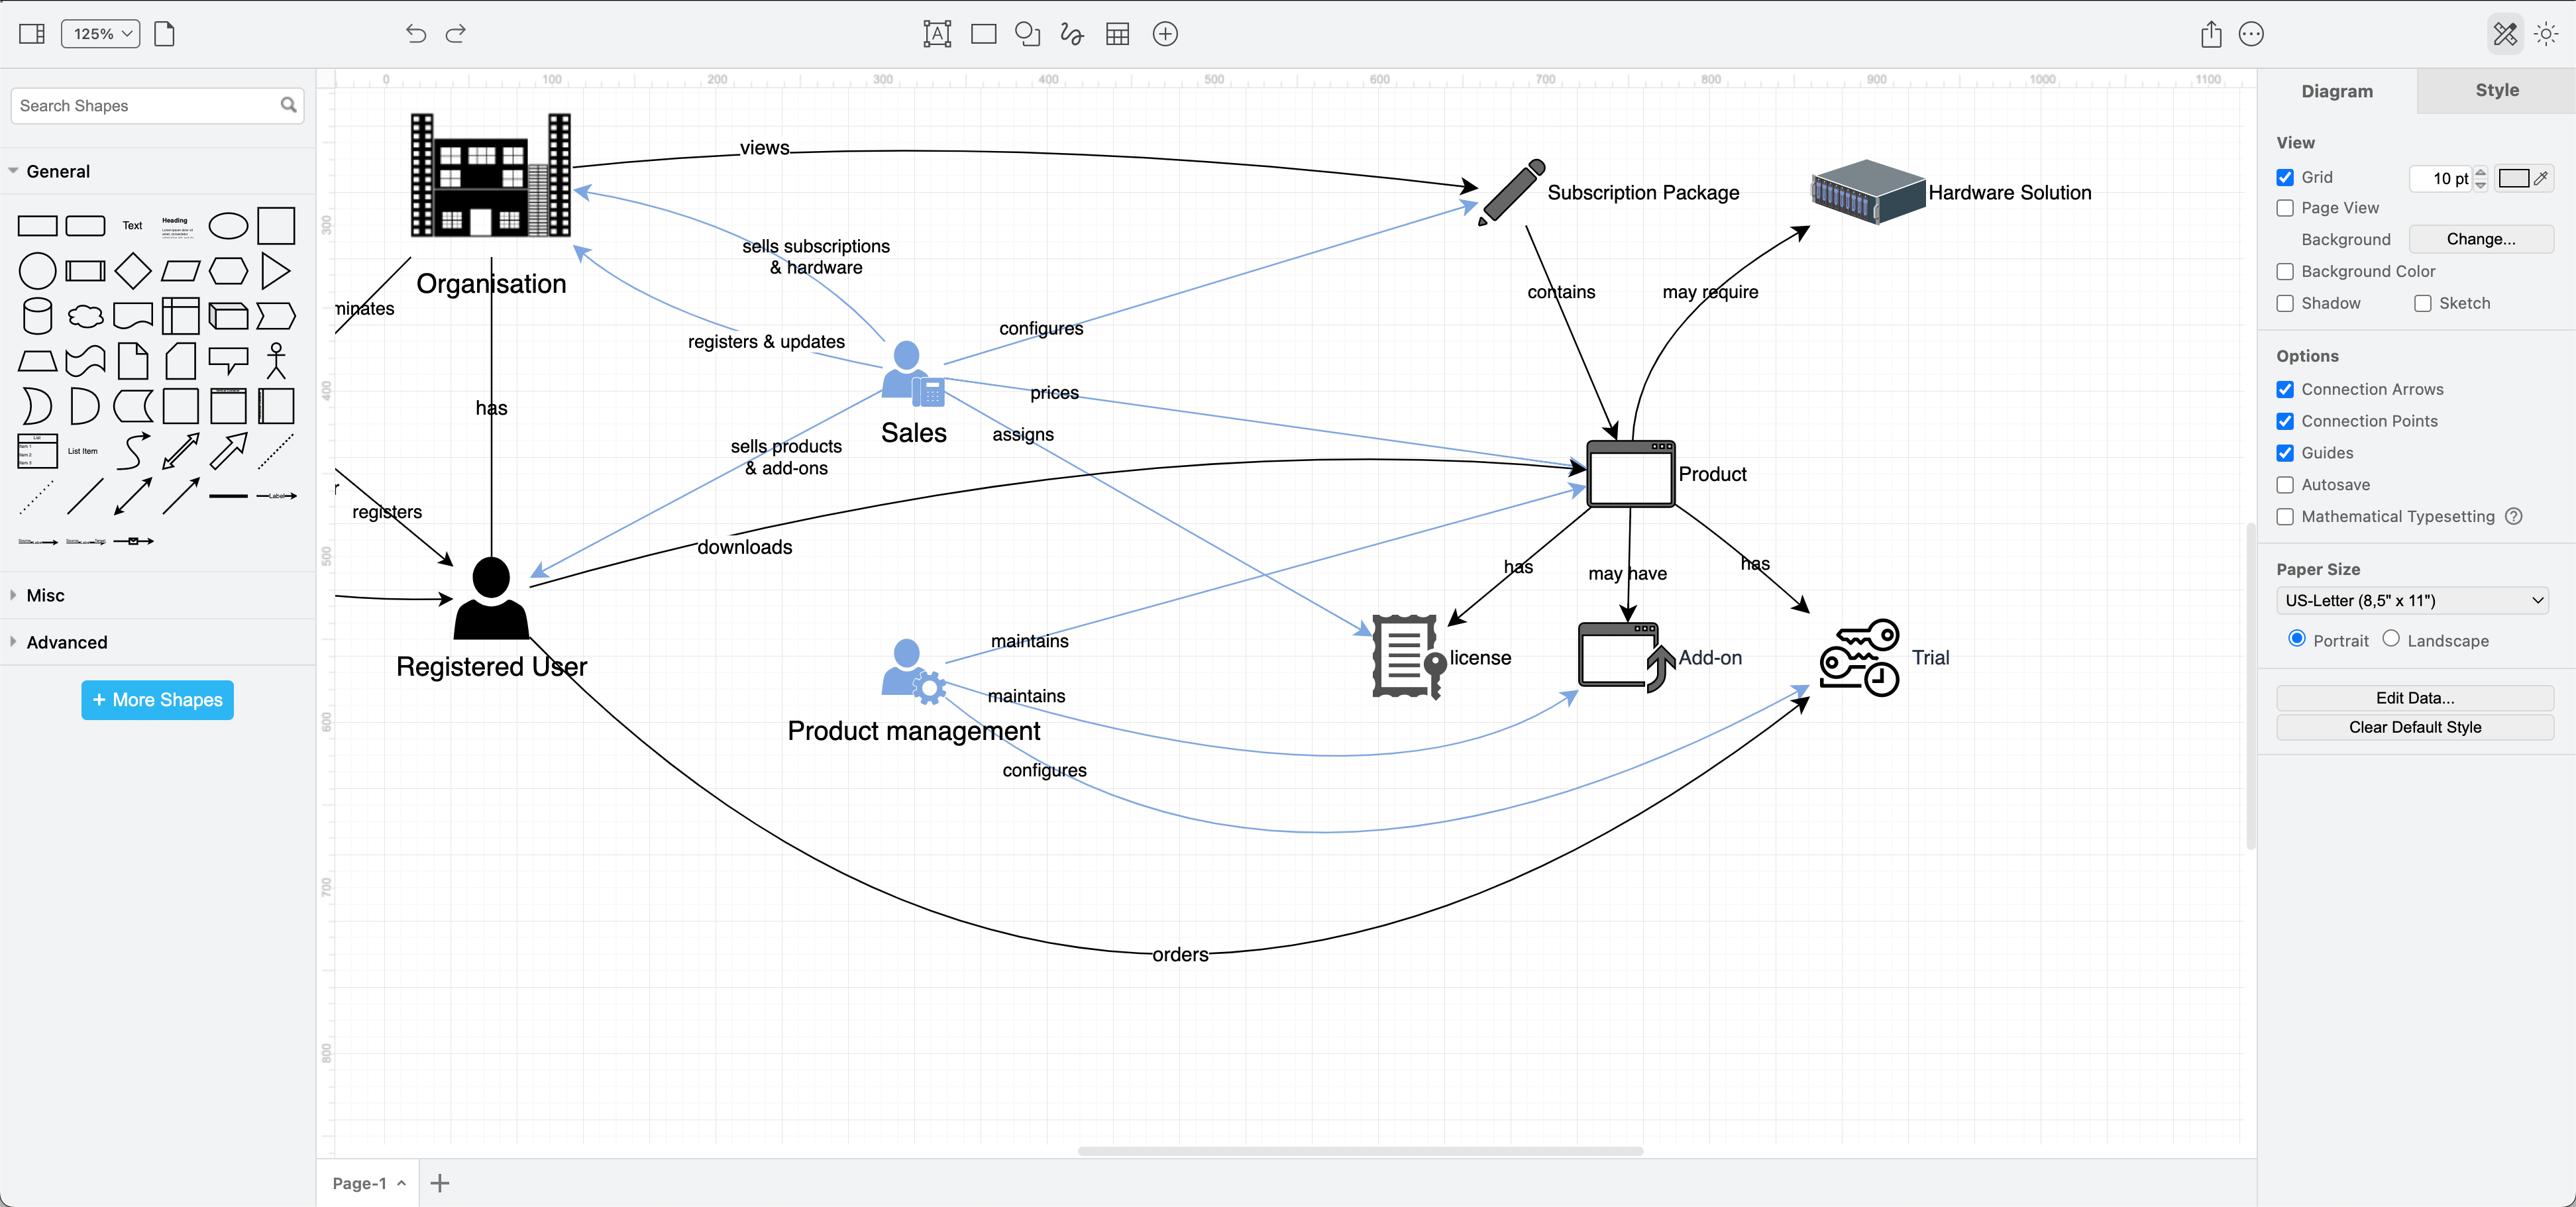
Then, draw connectors between the user roles and the objects to show which users are supposed to do what things with those objects. These are their responsibilities.
You aren’t limited to any particular shape library in draw.io, so you can search for shapes, clipart and icons that visually explain a particular role or object.
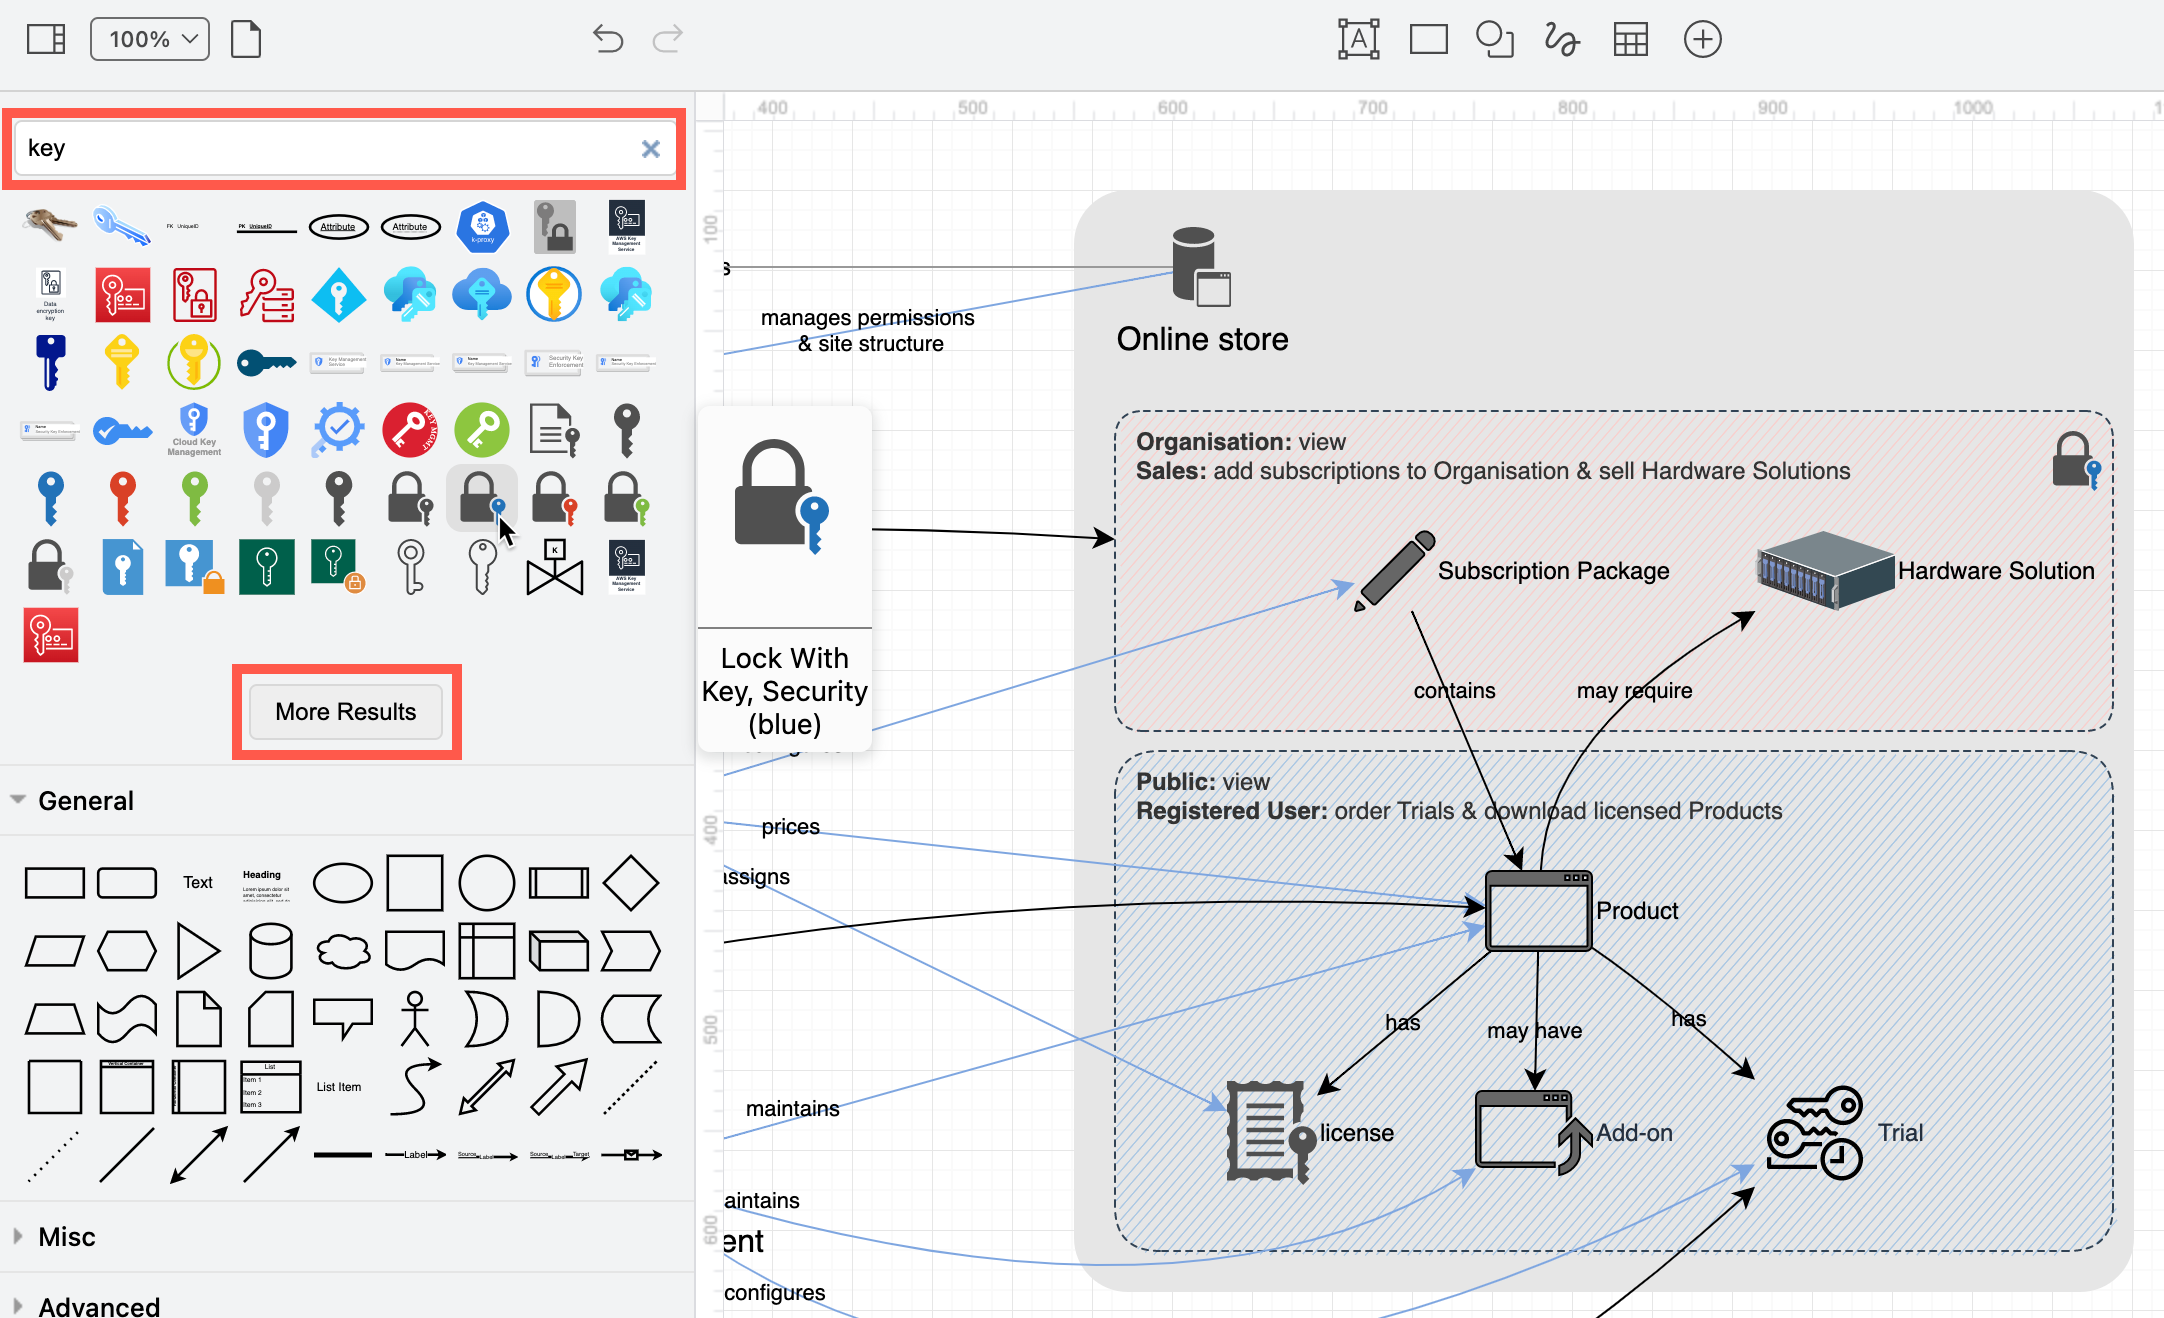
Search for shapes for roles and objects: Type a term into the search box at the top of the shapes panel and press Enter. Try related terms to find a shape that works the best in your diagram.
Click More Shapes if there are more results, and hover over any shape to see a larger preview.
Labelling responsibilities: Draw connectors between roles and objects in your system, and label them with how you intend that user to work with the system.
If you need to move a label, select the connector, then drag the yellow diamond to another location on the drawing canvas.
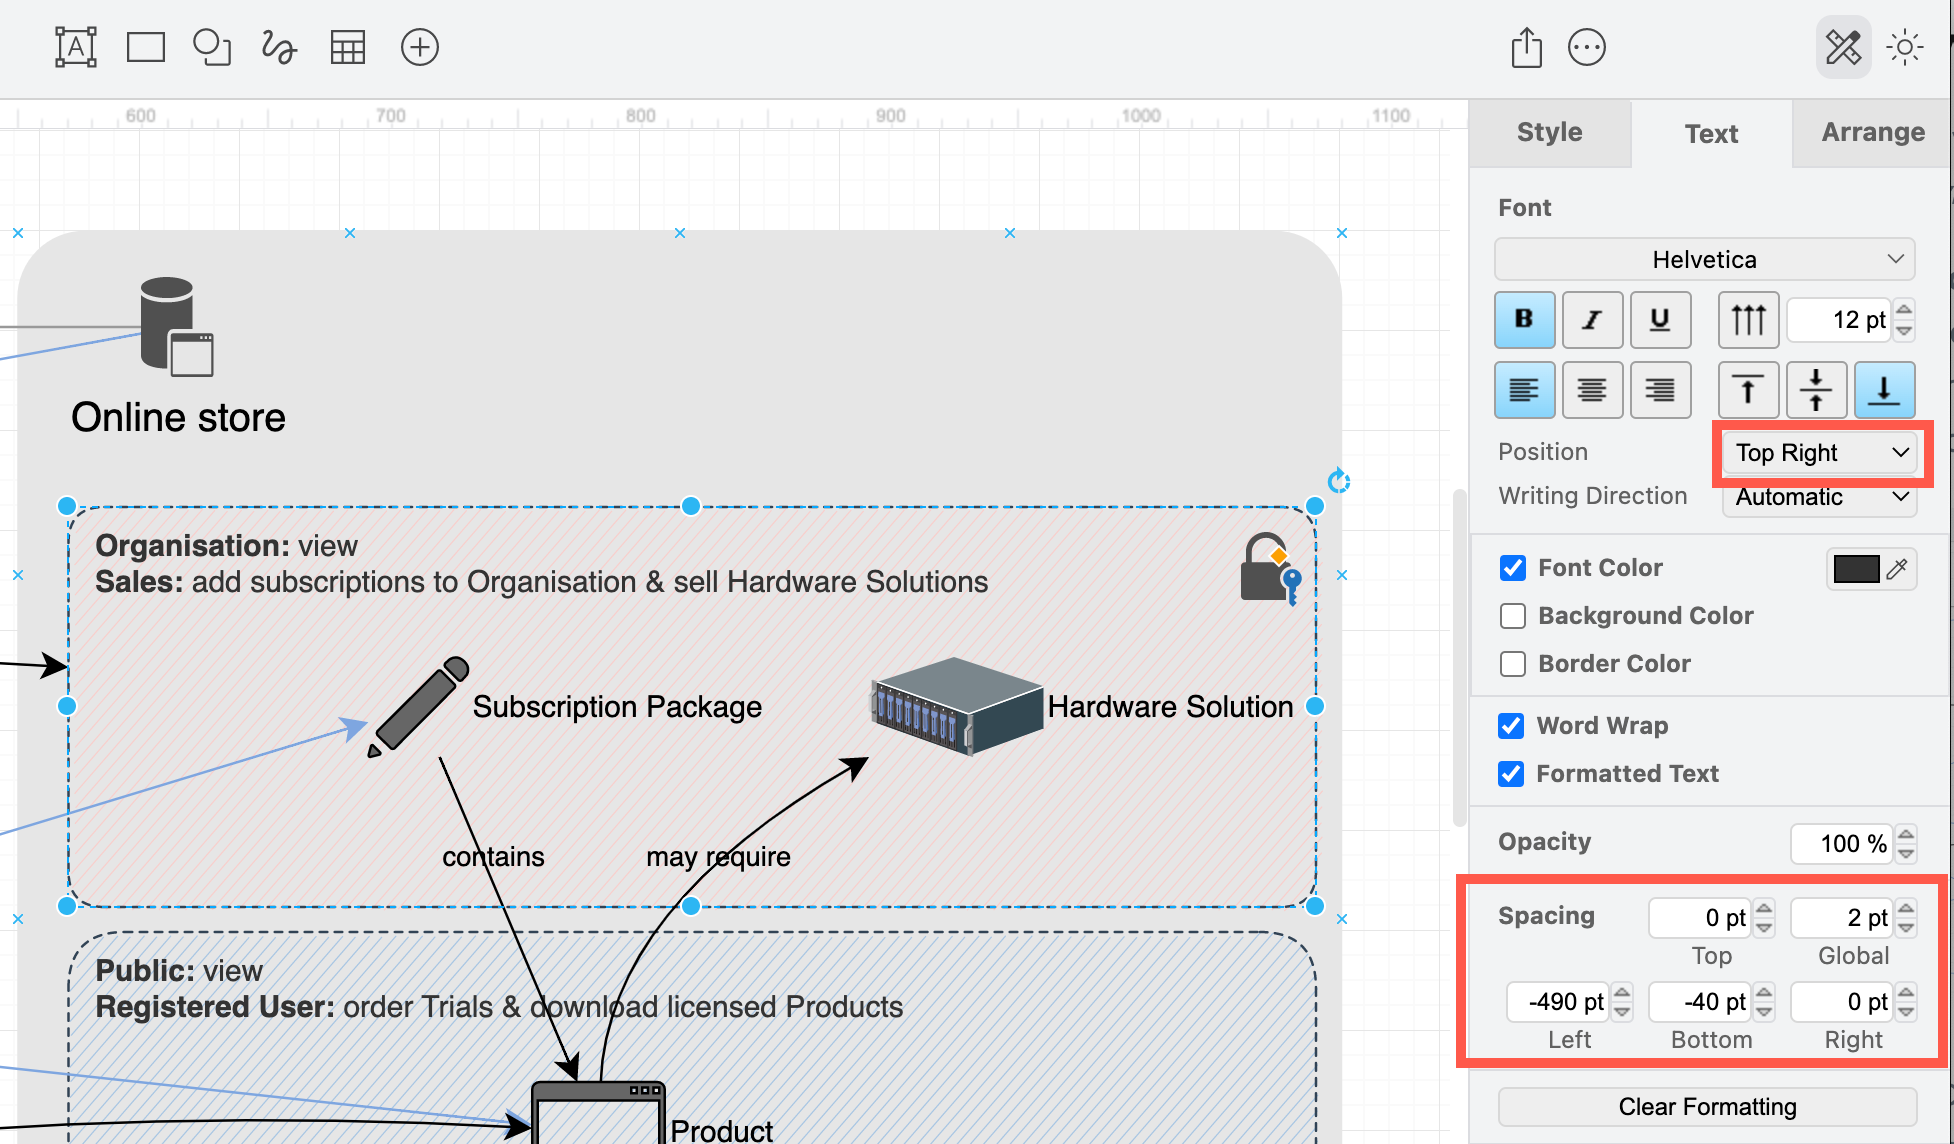
Use rectangles to show access limitations or logical groups of objects/roles: Add a rectangle and send it to the back via the Arrange tab of the format panel to visually group related objects, or create regions that show user access limitations.
Change the position of the rectangle’s label so it doesn’t overlap other shapes via the Text tab of the format panel.
Keep shapes together: Group shapes in these regions to make them easier to move around the drawing canvas.
Once you have grouped the shapes, you’ll need to send that group to the back to make sure any connectors coming into the group are visible on top. Select the group, and click To Back in the Arrange tab of the format panel.
By visualising your system’s objects, roles and responsibilities first, without considering any implementation details, it will be easier to subsequently diagram the specifics of the system in other types of diagrams such as UML use case, sequence diagrams, class diagrams and so on.
More example diagrams
See our example gallery for more ways to visualise your system.