Diagrams for a better incident response
Industries and services need to plan for when an incident happens, both to provide good customer service and ensure the safety of all those affected. When responding quickly to an incident, diagrams are easier to read and put into action than paragraphs of text.
An incident response plan identifies the people and assets you need to protect, details the best way to handle the situation, and helps prevent similar incidents from happening in the future.
Use diagrams in incident response planning to:
- define responsibility and support roles
- identify areas that could be simplified and automated
- build consensus across teams, departments and external parties
- onboard and train new team members
- mitigate confusion and panic in the event of an incident
- conduct an analysis after an incident has occurred
IT service management (ITSM) and data security teams must document and respond to incidents according to their service level agreements (SLAs). If your company is ISO/IEC 20000 accredited, diagrams will be used to document the system architecture, provision of services, and incident response plans.
Businesses of all sizes must also plan in case of a data breach under the GDPR. These are relatively simple when compared to the complex accident and safety plans required by the chemical industry.
Tip: Many of the diagrams used in incident response planning are also used in event planning, disaster management and change planning.
Diagrams for incident response plans
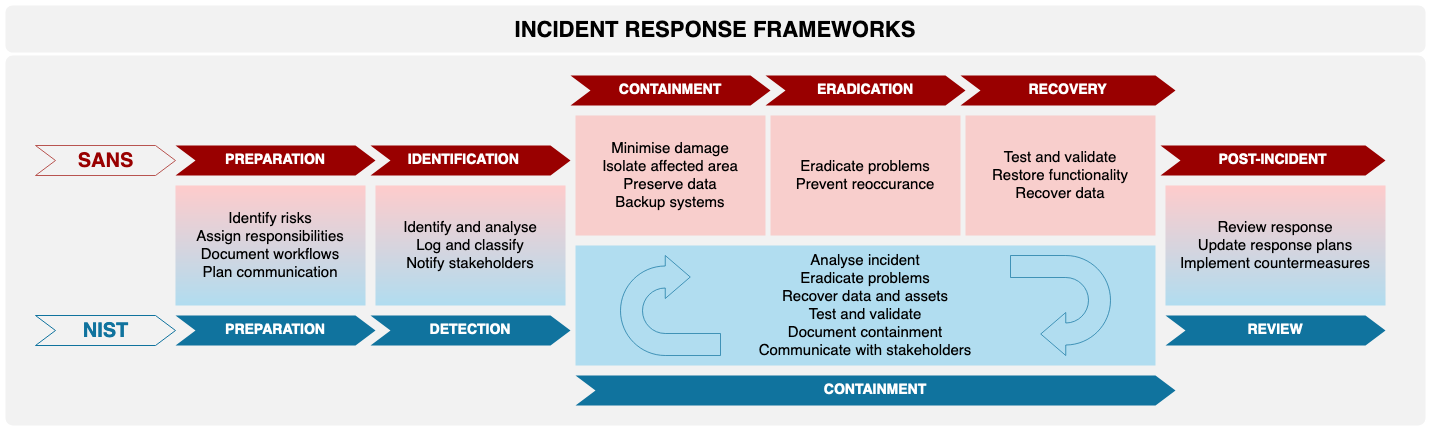
Flowcharts for all processes
Some incidents can be resolved with a simple checklist, but many require decisions and include branching paths.
Workflows or cross-functional flowcharts that follow a standard like BPMN 2.0 make cross-team communication easier. These workflows don’t have to be complex, but the consistent selection of shapes reduces confusion.
- Click More shapes, enable the checkbox next to the BPMN 2.0 shape library in the Business section, then click Apply.
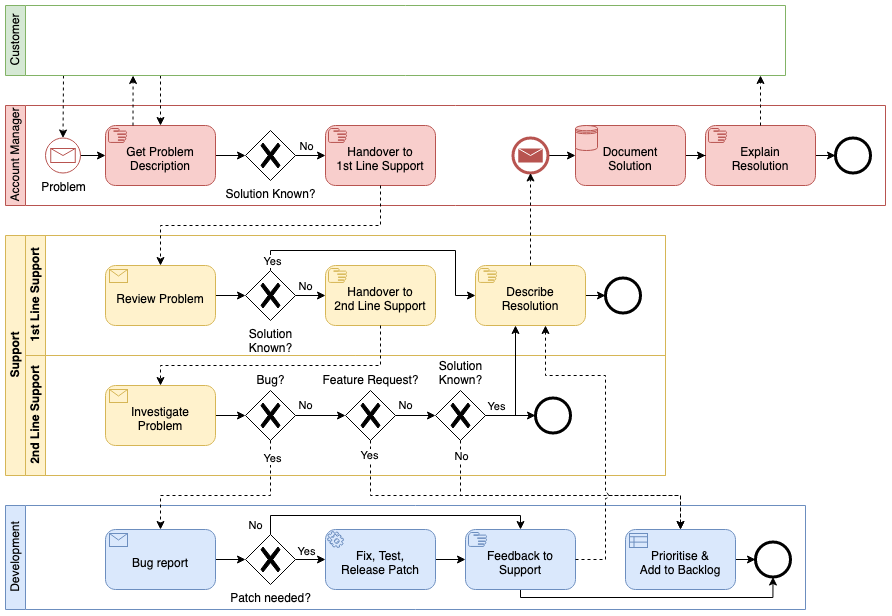
Tip: When training new team members, they need only focus on their particular lane.
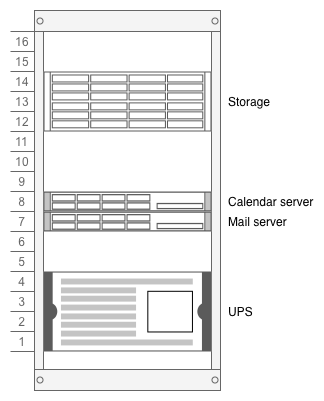
Document your infrastructure
Draw your cloud network and rack layouts in diagrams to allow engineers to quickly identify and resolve both hardware and software incidents.
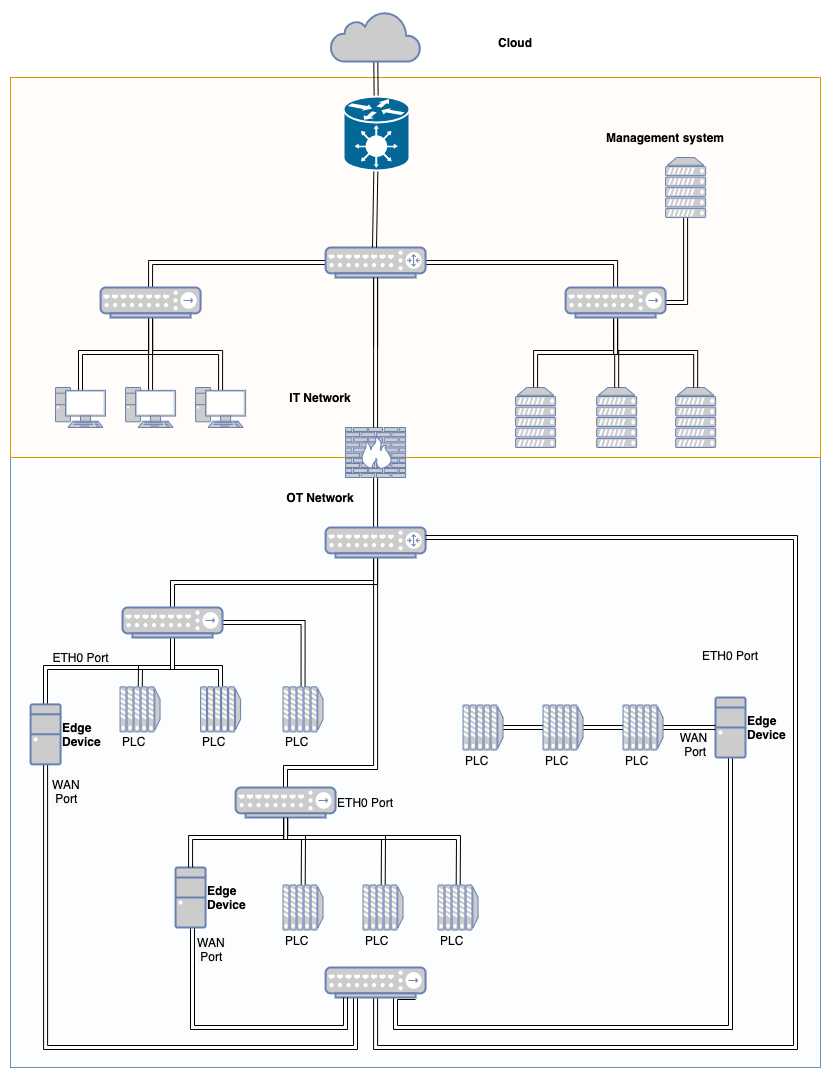
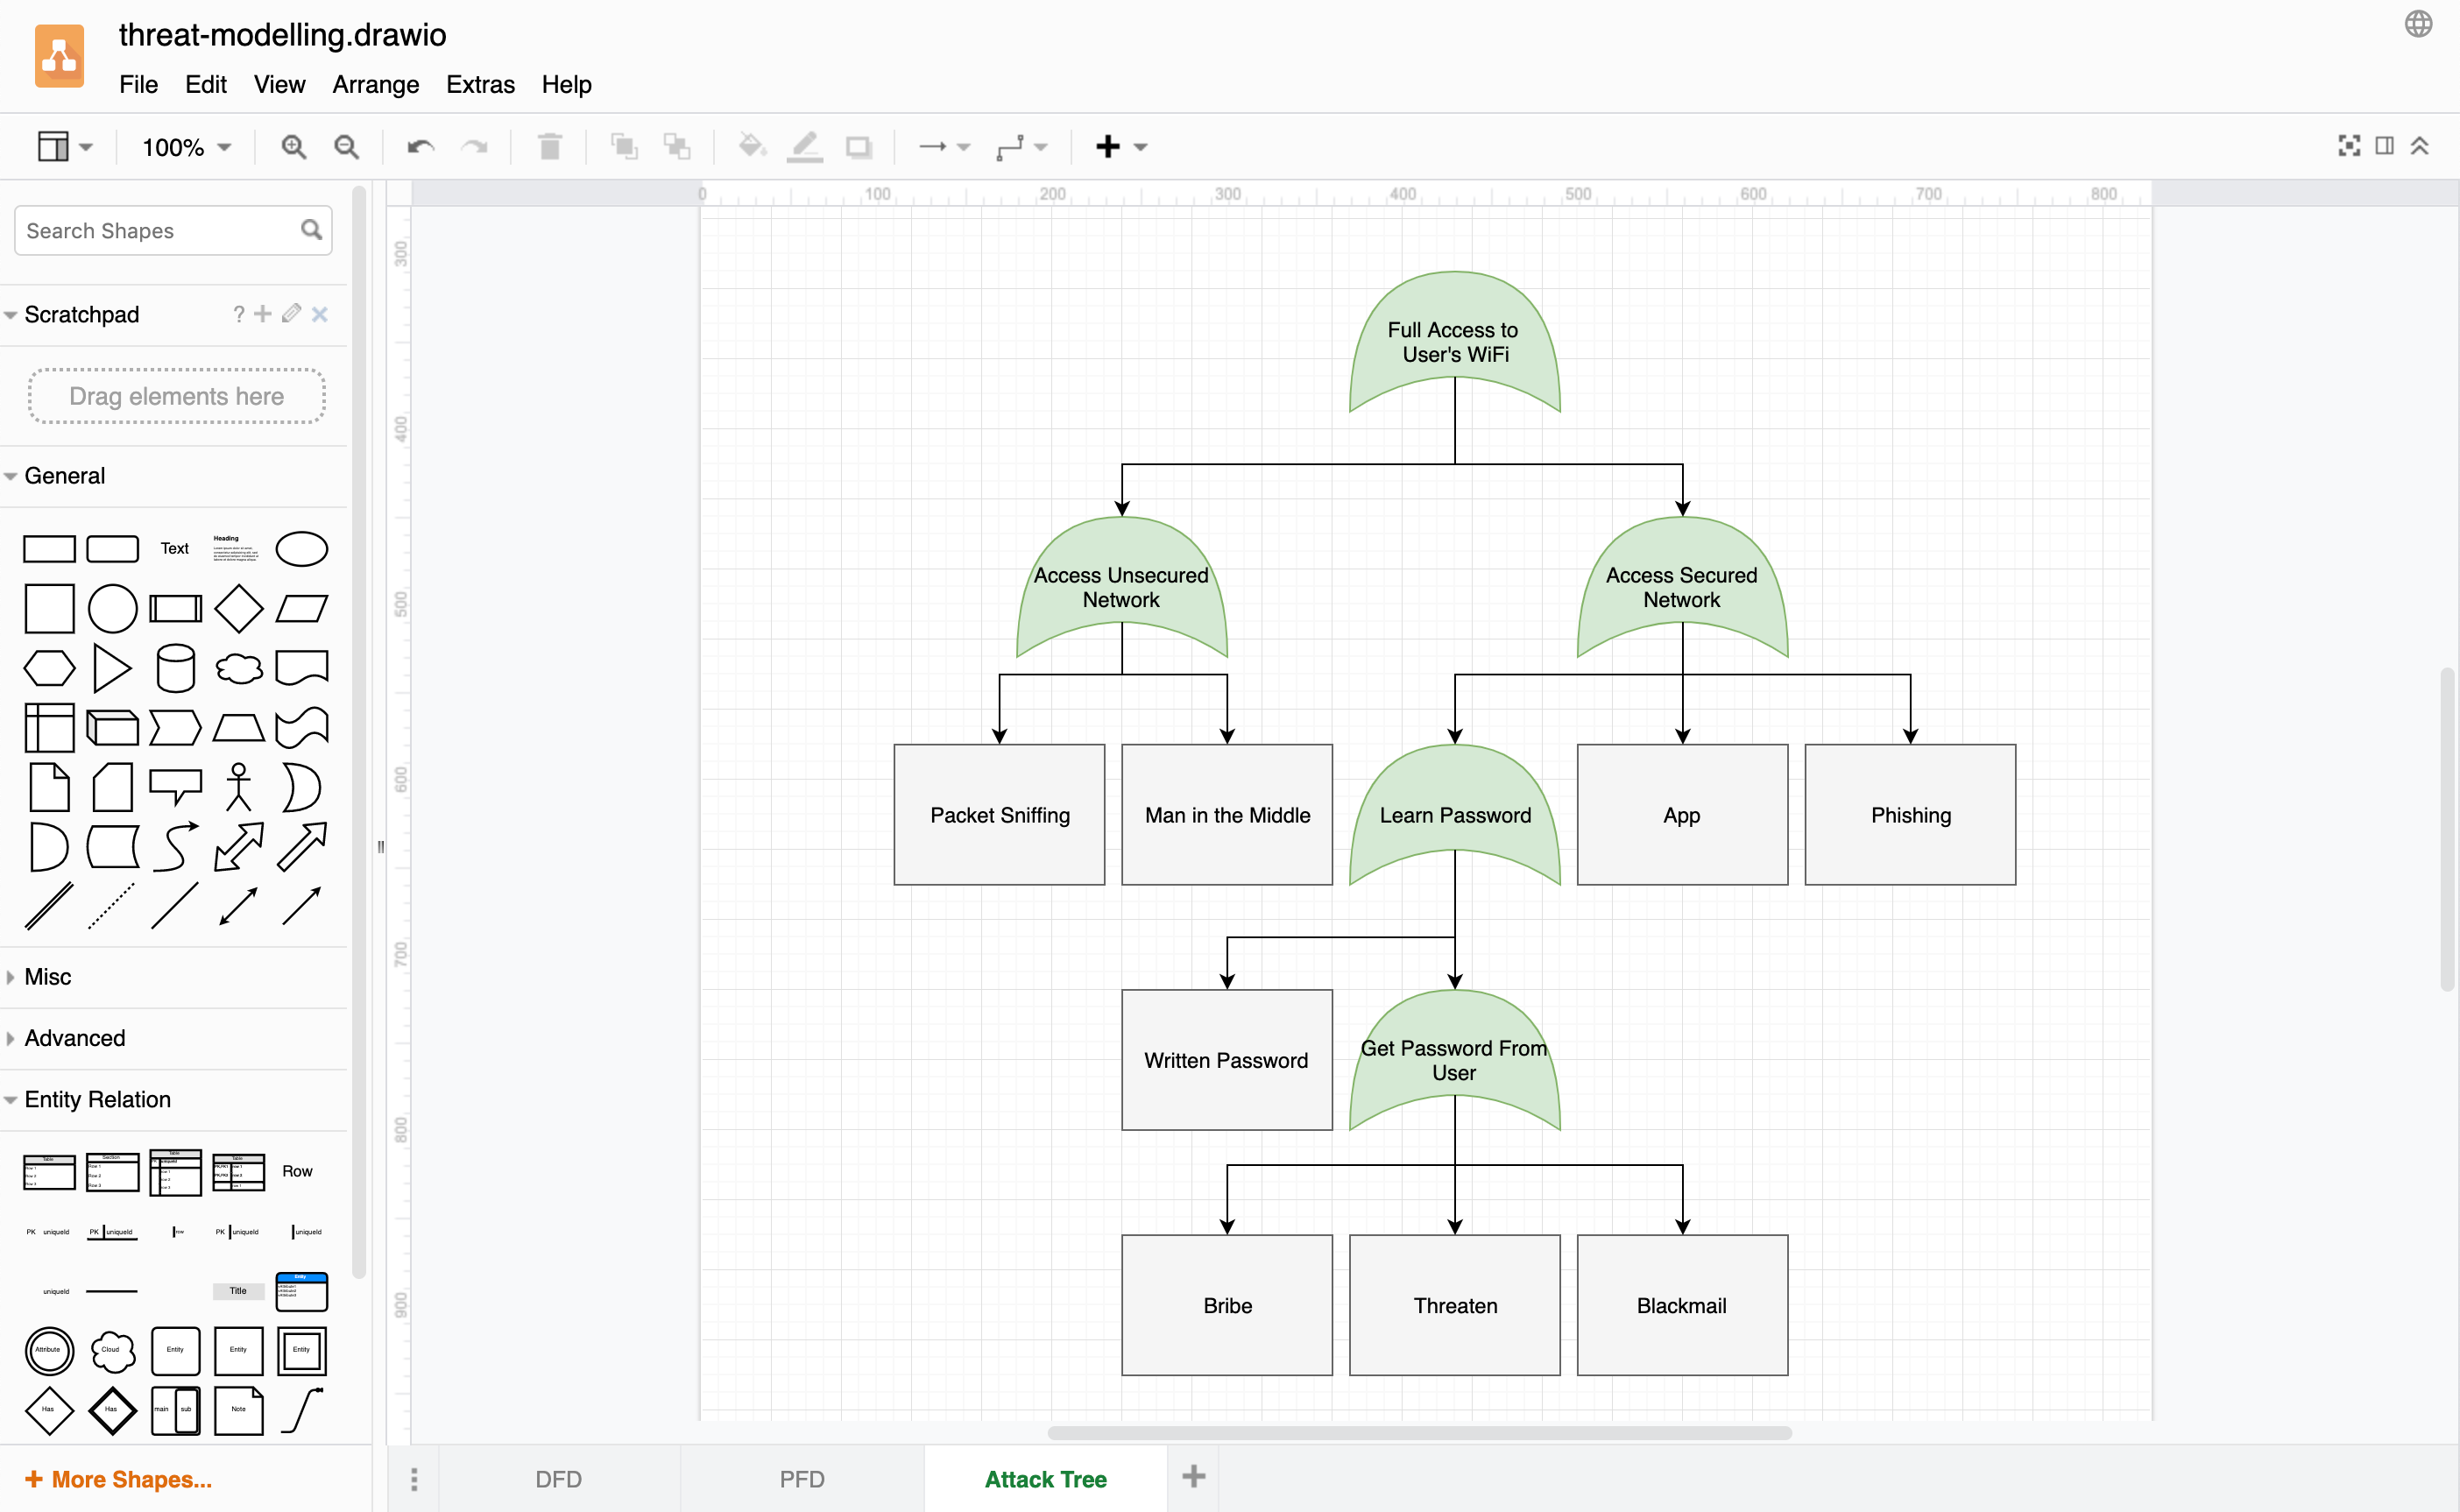
Prior to an incident, analyse threats with attack trees and the threat modelling shape library to identify where problems may occur.
Floor plans and area layouts
Not all incidents are digital - fires, physical security breaches, and health emergencies should also be planned for.
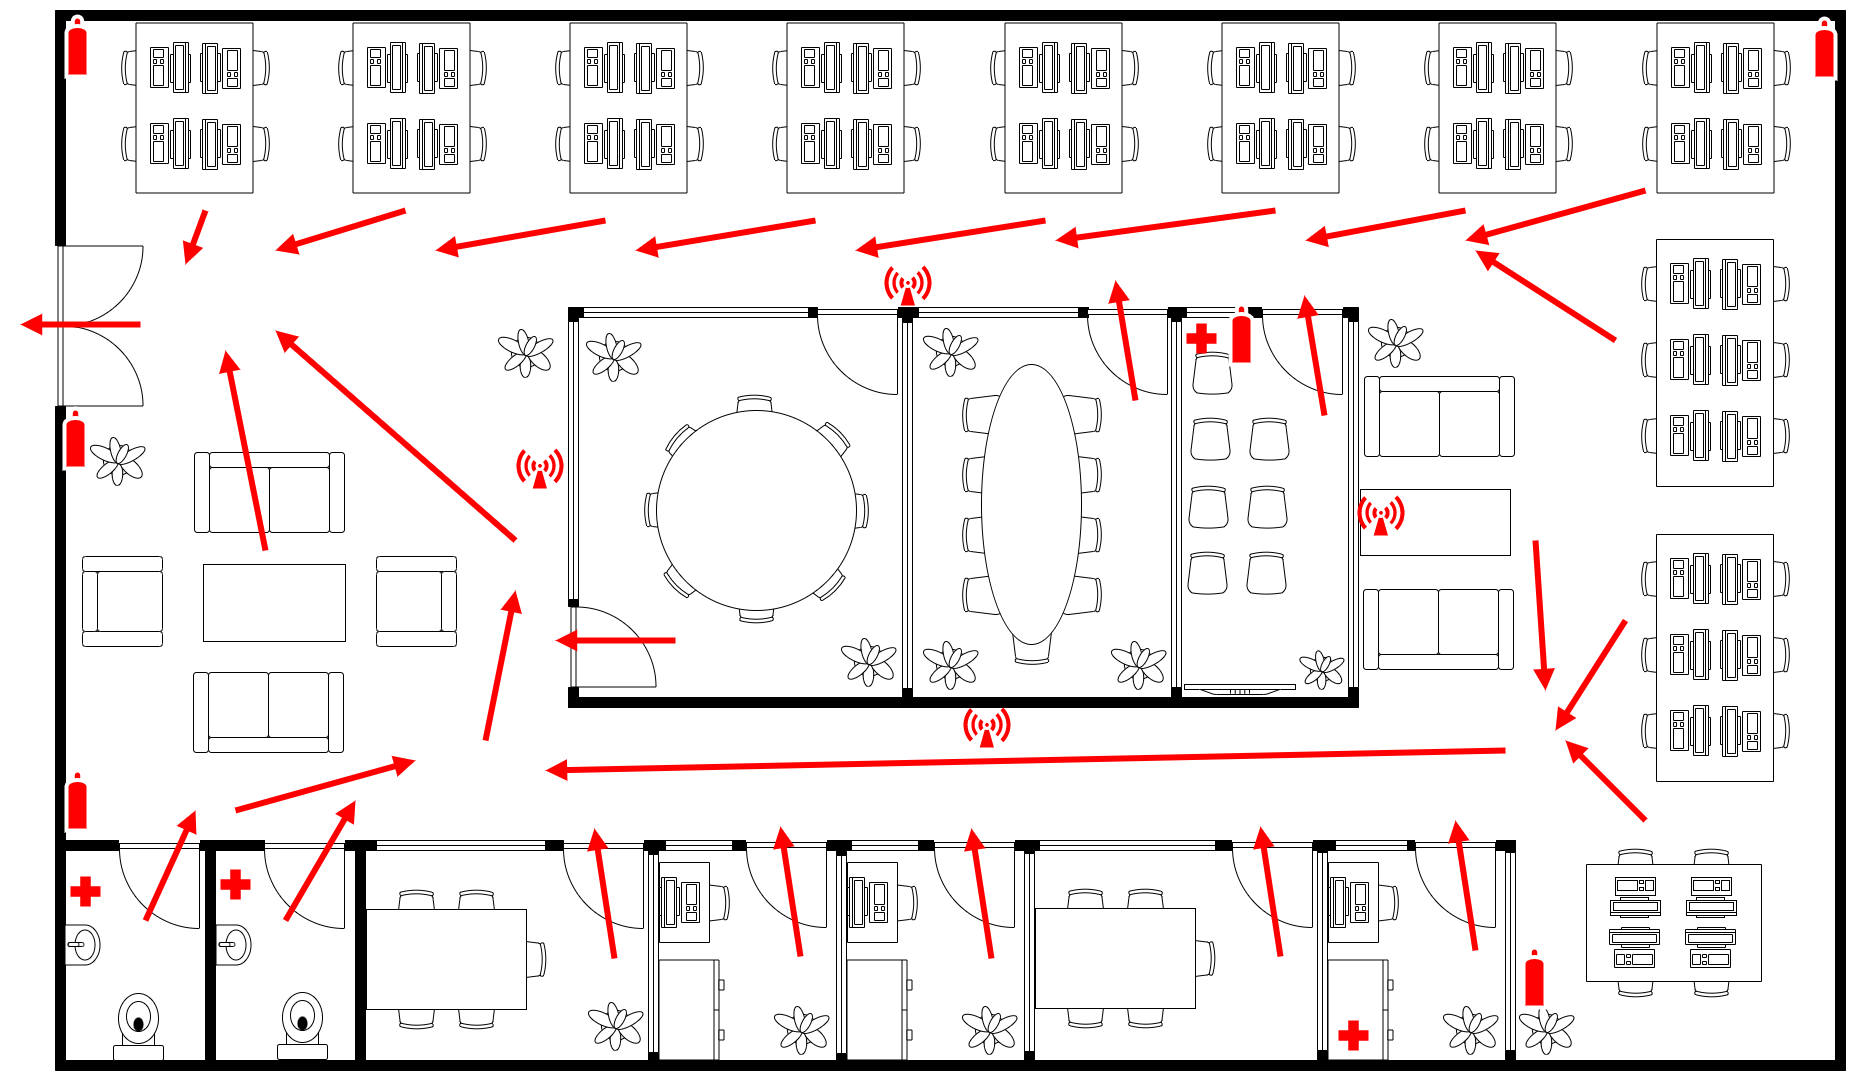
Use the Floor Plans shape library to draw your space and note evacuation paths, fire fighting equipment, and information points. If you are creating an incident response plan for a laboratory, include all of the health and safety measures on your plan.
If your incident occurs over a wide area, use a map as the diagram background and annotate it with text labels, connectors and shapes to convey the additional information.
Organisation charts
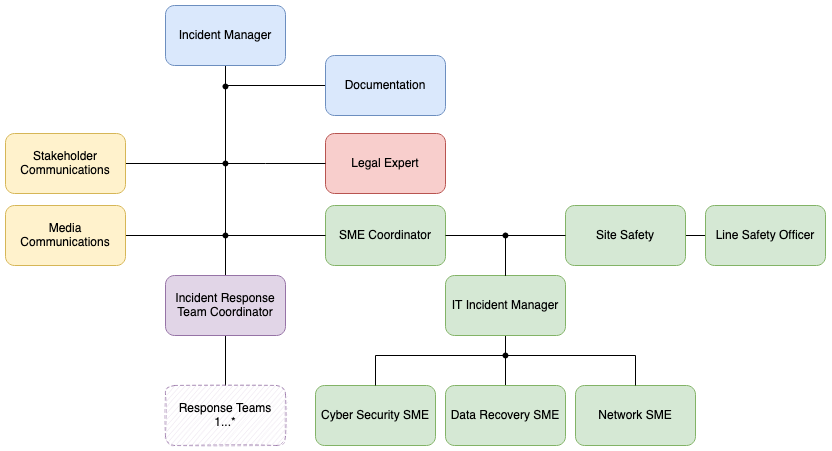
Define the incident response team in an org chart and, if unclear, note their responsibilities and specialities.
While you could use a responsibility assignment matrix (RAM or RACI chart), these are text-based tables, and as there are many different ways to note responsibilities, they may be confusing in high-pressure situations.
Communicate the reponse plan
Store your plans centrally: Make sure they are easily accessed in case of an incident. The draw.io app for Confluence and our Chrome extension for Notion let you embed diagrams directly into your information repository.
Infographics for training: Draw with the Infographics shape library and embed diagram in a presentation or training document with our add-ons for MS Office or Google Workspace, or in a wiki page with our draw.io app for Confluence.
Diagrams during an incident
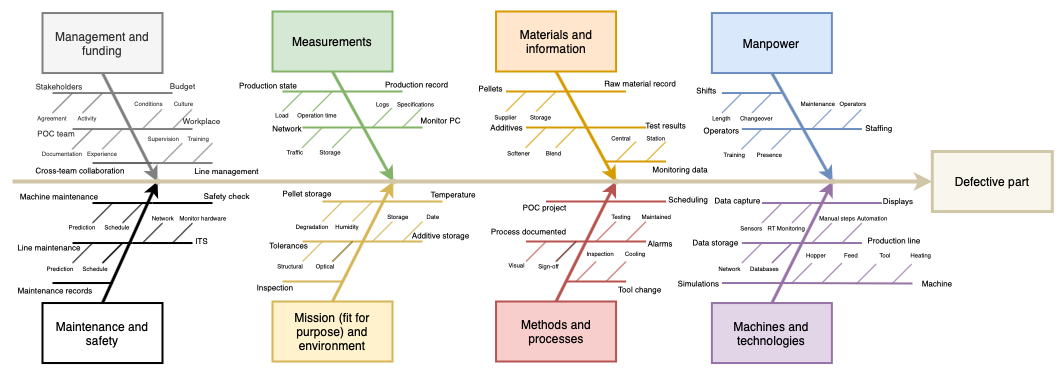
Root cause analysis
Find contributing problems that have led to the incident by drawing a fishbone or Ishikawa diagram. There will likely be more than one cause.
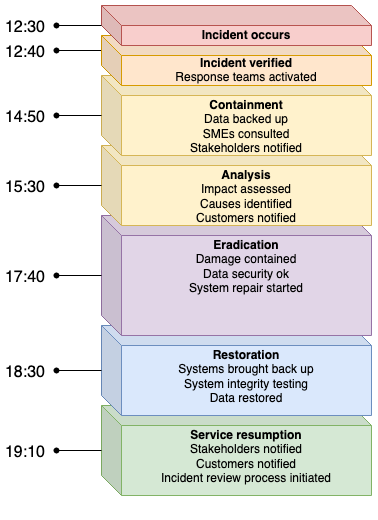
Incident response timeline
Note which steps were taken and when from the moment an incident was detected until it was resolved. This helps you to pinpoint problems with response workflows and gaps in expert knowledge. Timelines are easy to create in draw.io - teams can keep adding to it as they respond.
Tip: Keep your diagrams simple during an incident and use shapes and text from the basic shape libraries. You can edit and style the diagrams afterwards if you need to use them in reports and presentations.
Incident planning standards
If you run a business and provide services and products to customers, you need to plan for incidents. You may even be audited on these plans if accredited.
A few international standards are highly specific - ISO 23120:2022 even details which symbols should be used in computer-based incident response systems.
Some of the more common ISO standards that include incident management are:
- ISO 45000 and related standards for occupational health and safety
- ISO/PAS 22399:2007 for incident preparedness and operational continuity
- ISO 22320:2018 for incident management as part of emergency management
ISO notes that production chains have become more complex worldwide, and has recently formed a group to develop guidelines for dealing with consumer incidents due to faulty products.