Analysing vulnerabilities with threat modelling using draw.io
Threat modelling, especially in IT, is becoming more common. Companies are increasingly aware of the risks of having their infrastructure and devices connected to the internet. As more devices, machines, sensors, monitors, and applications are added to a company’s infrastructure, there are potentially many more vulnerabilities.
According to Wikipedia, threat modelling should answer:
- Where am I most vulnerable to attack?
- What are the most relevant threats?
- What do I need to do to safeguard against these threats?
Diagram types used in threat modelling
Vulnerabilities are more easily represented visually using a few different diagram types, all of which can be created using diagrams.net.
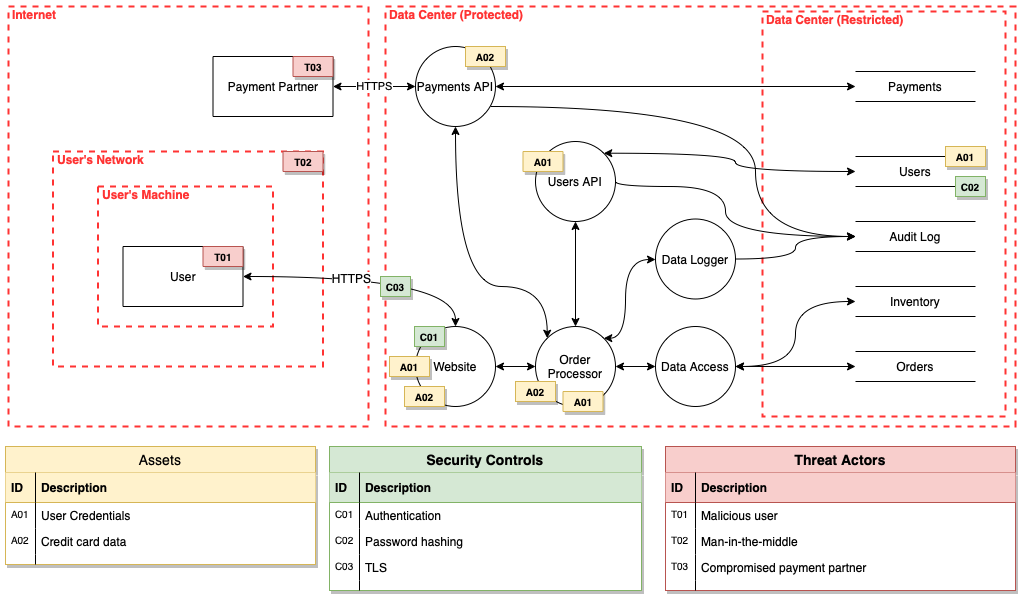
Data flow diagrams (DFDs)
Threat modelling DFDs are similar to those used by system engineers, with a few additional shapes. Operational or infrastructure threat models (OTMs) are a specific type of data flow diagram, visualising how the independent, grouped, and shared components communicate with each other and external entities via connection pathways.
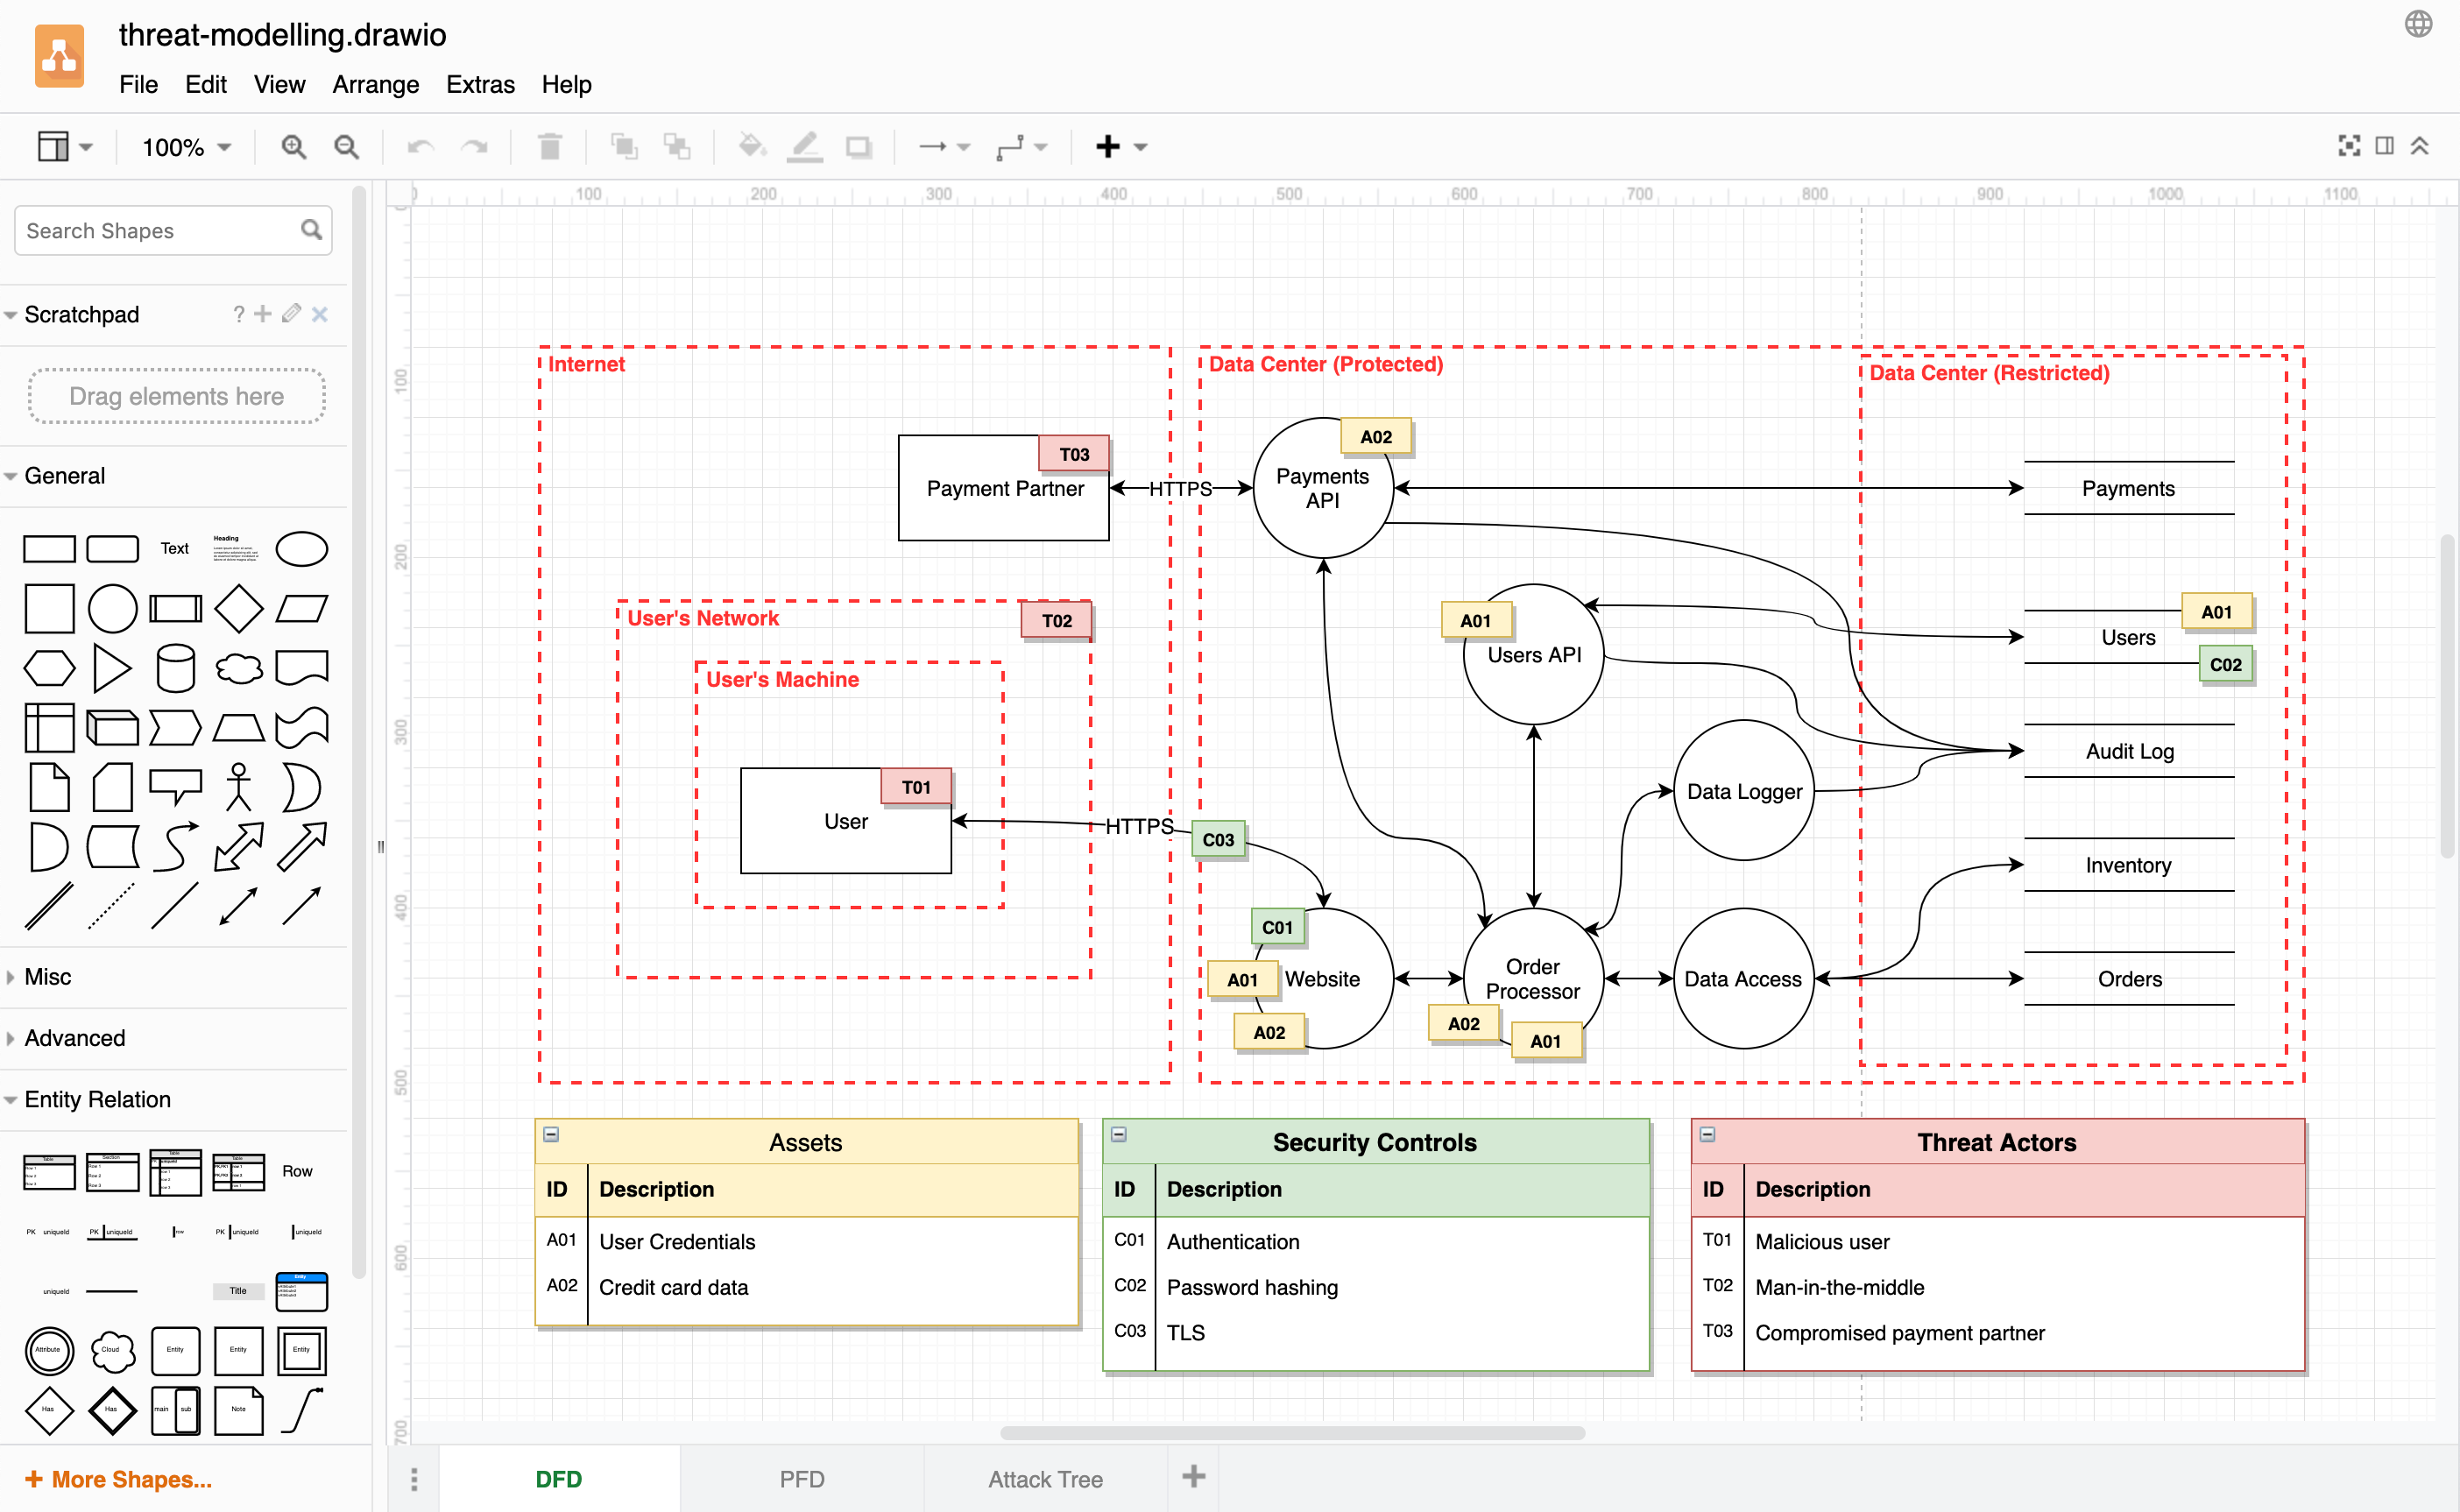
Process flow diagrams (PFDs)
These are used by agile teams to build application threat models (ATMs). Agile software development teams can analyse their applications and features by critically examining the communication protocols used to connect the code’s building blocks together.
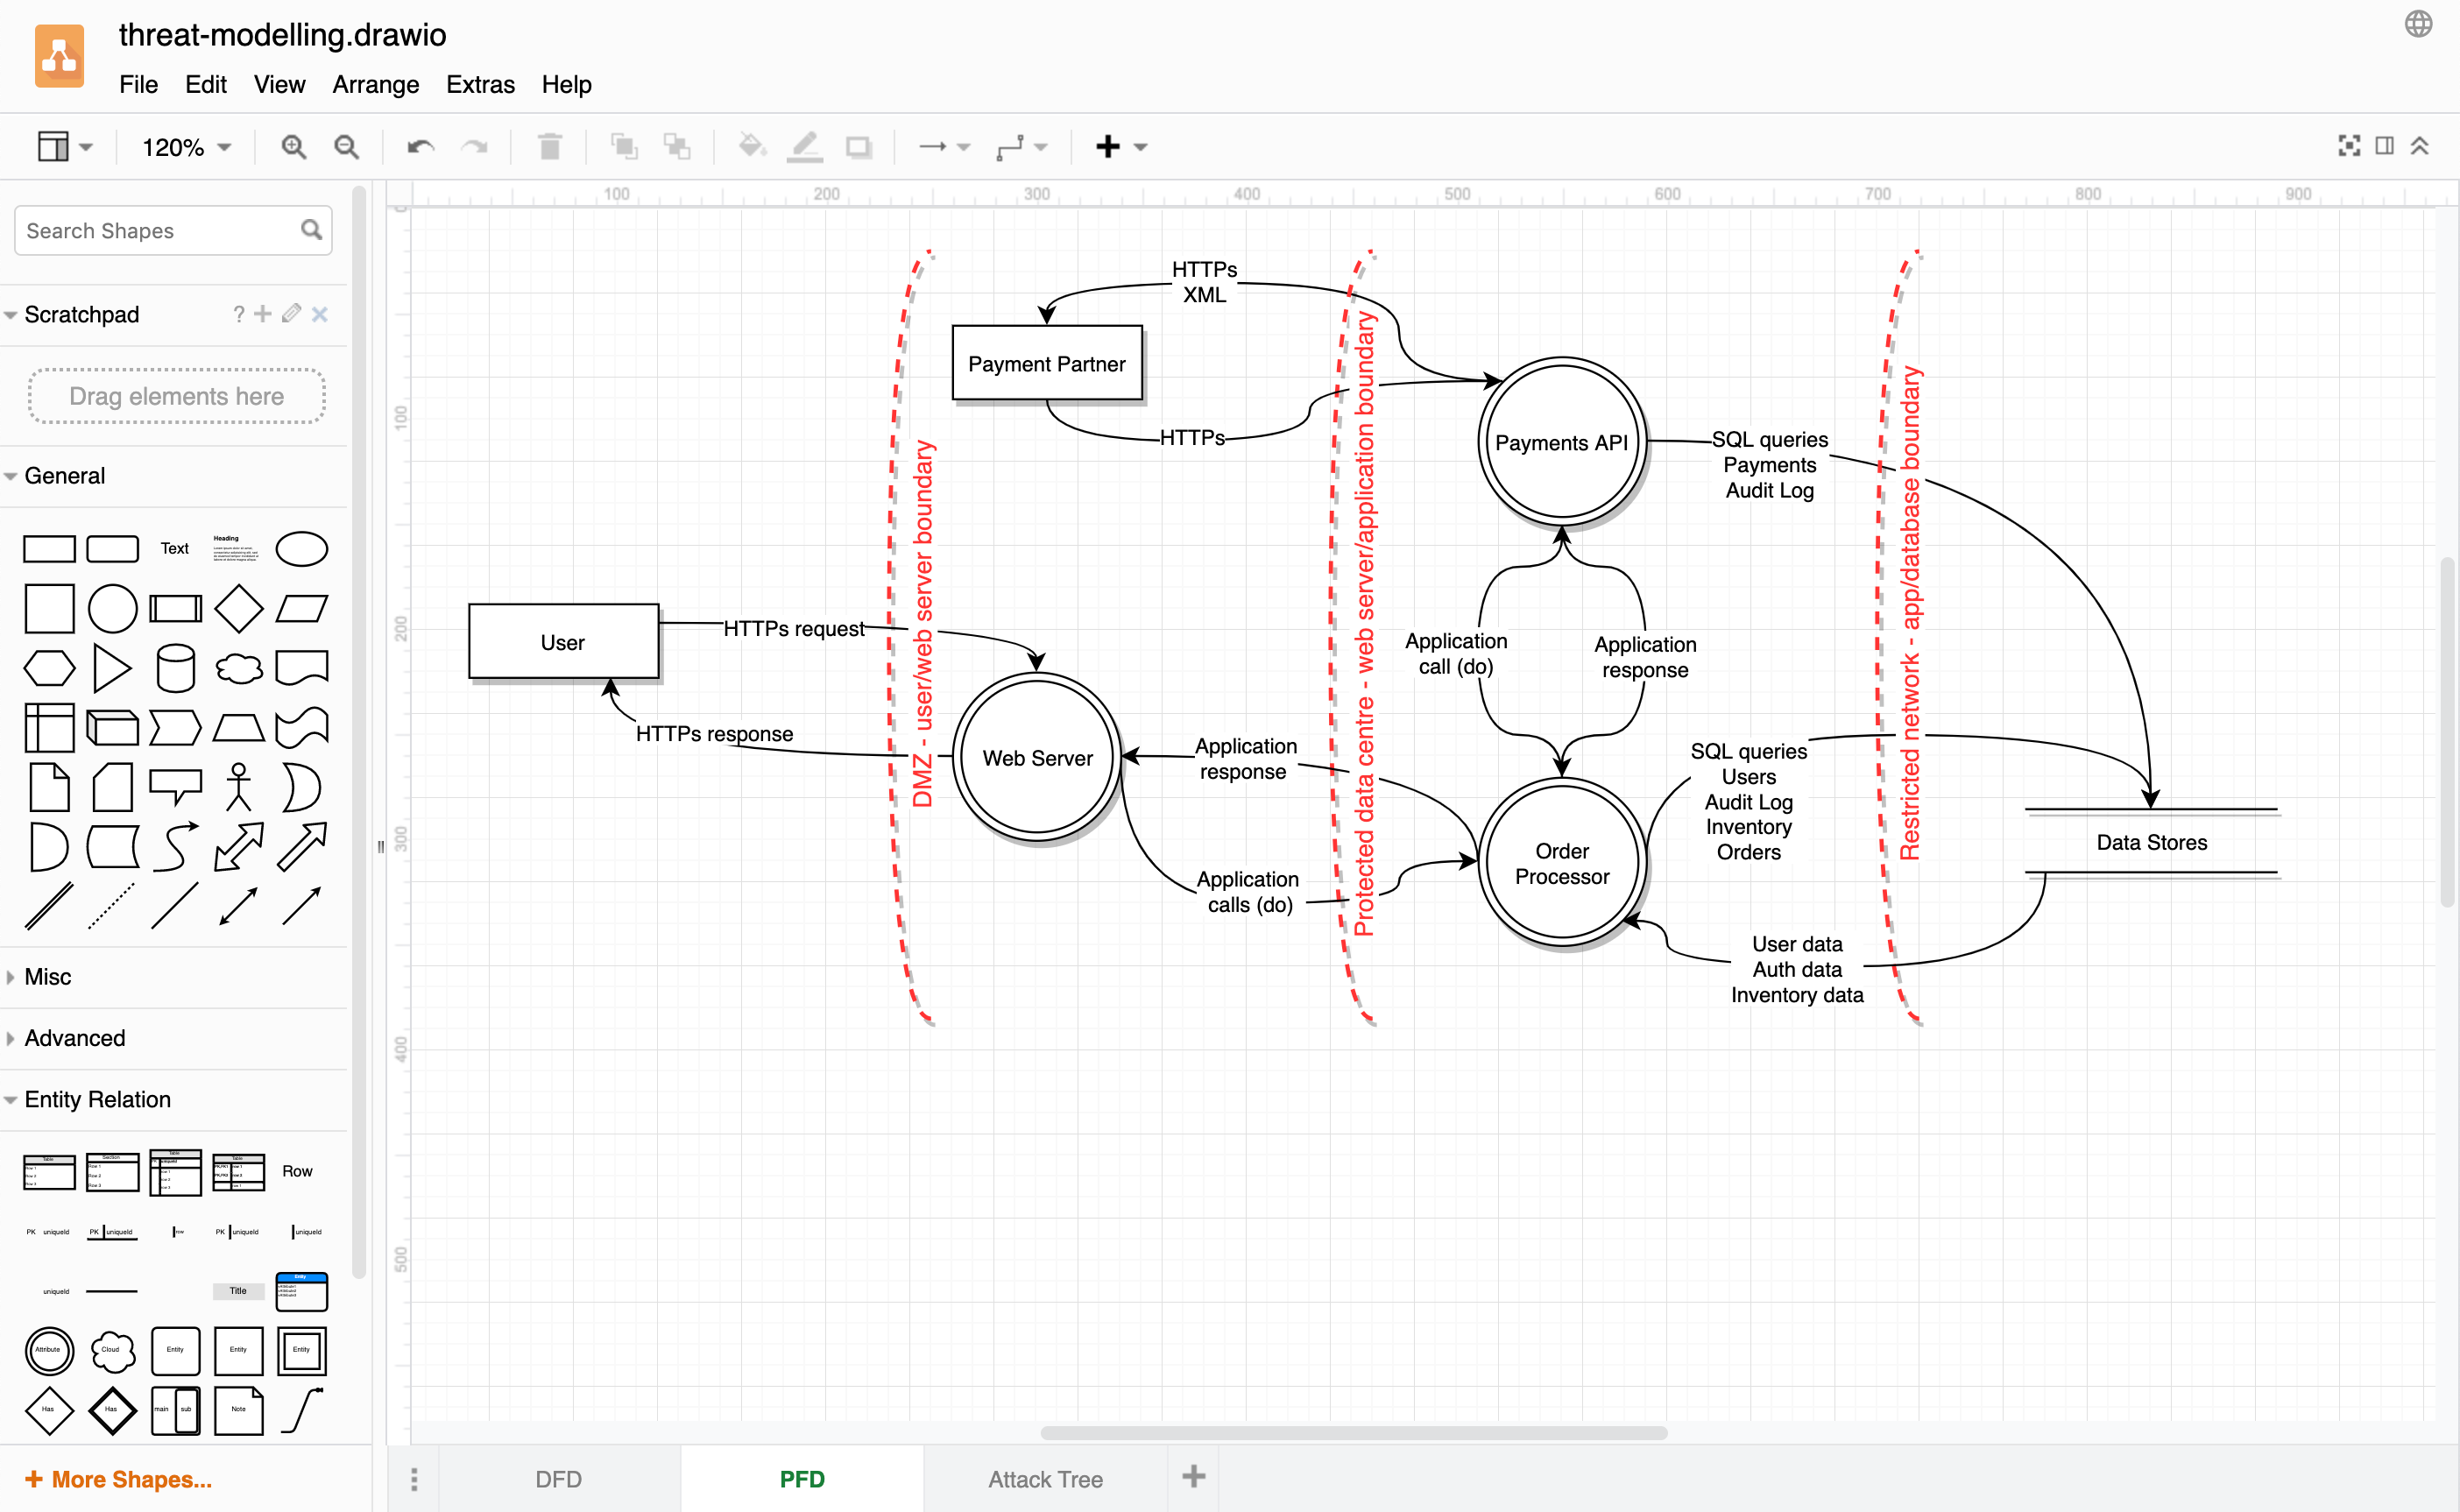
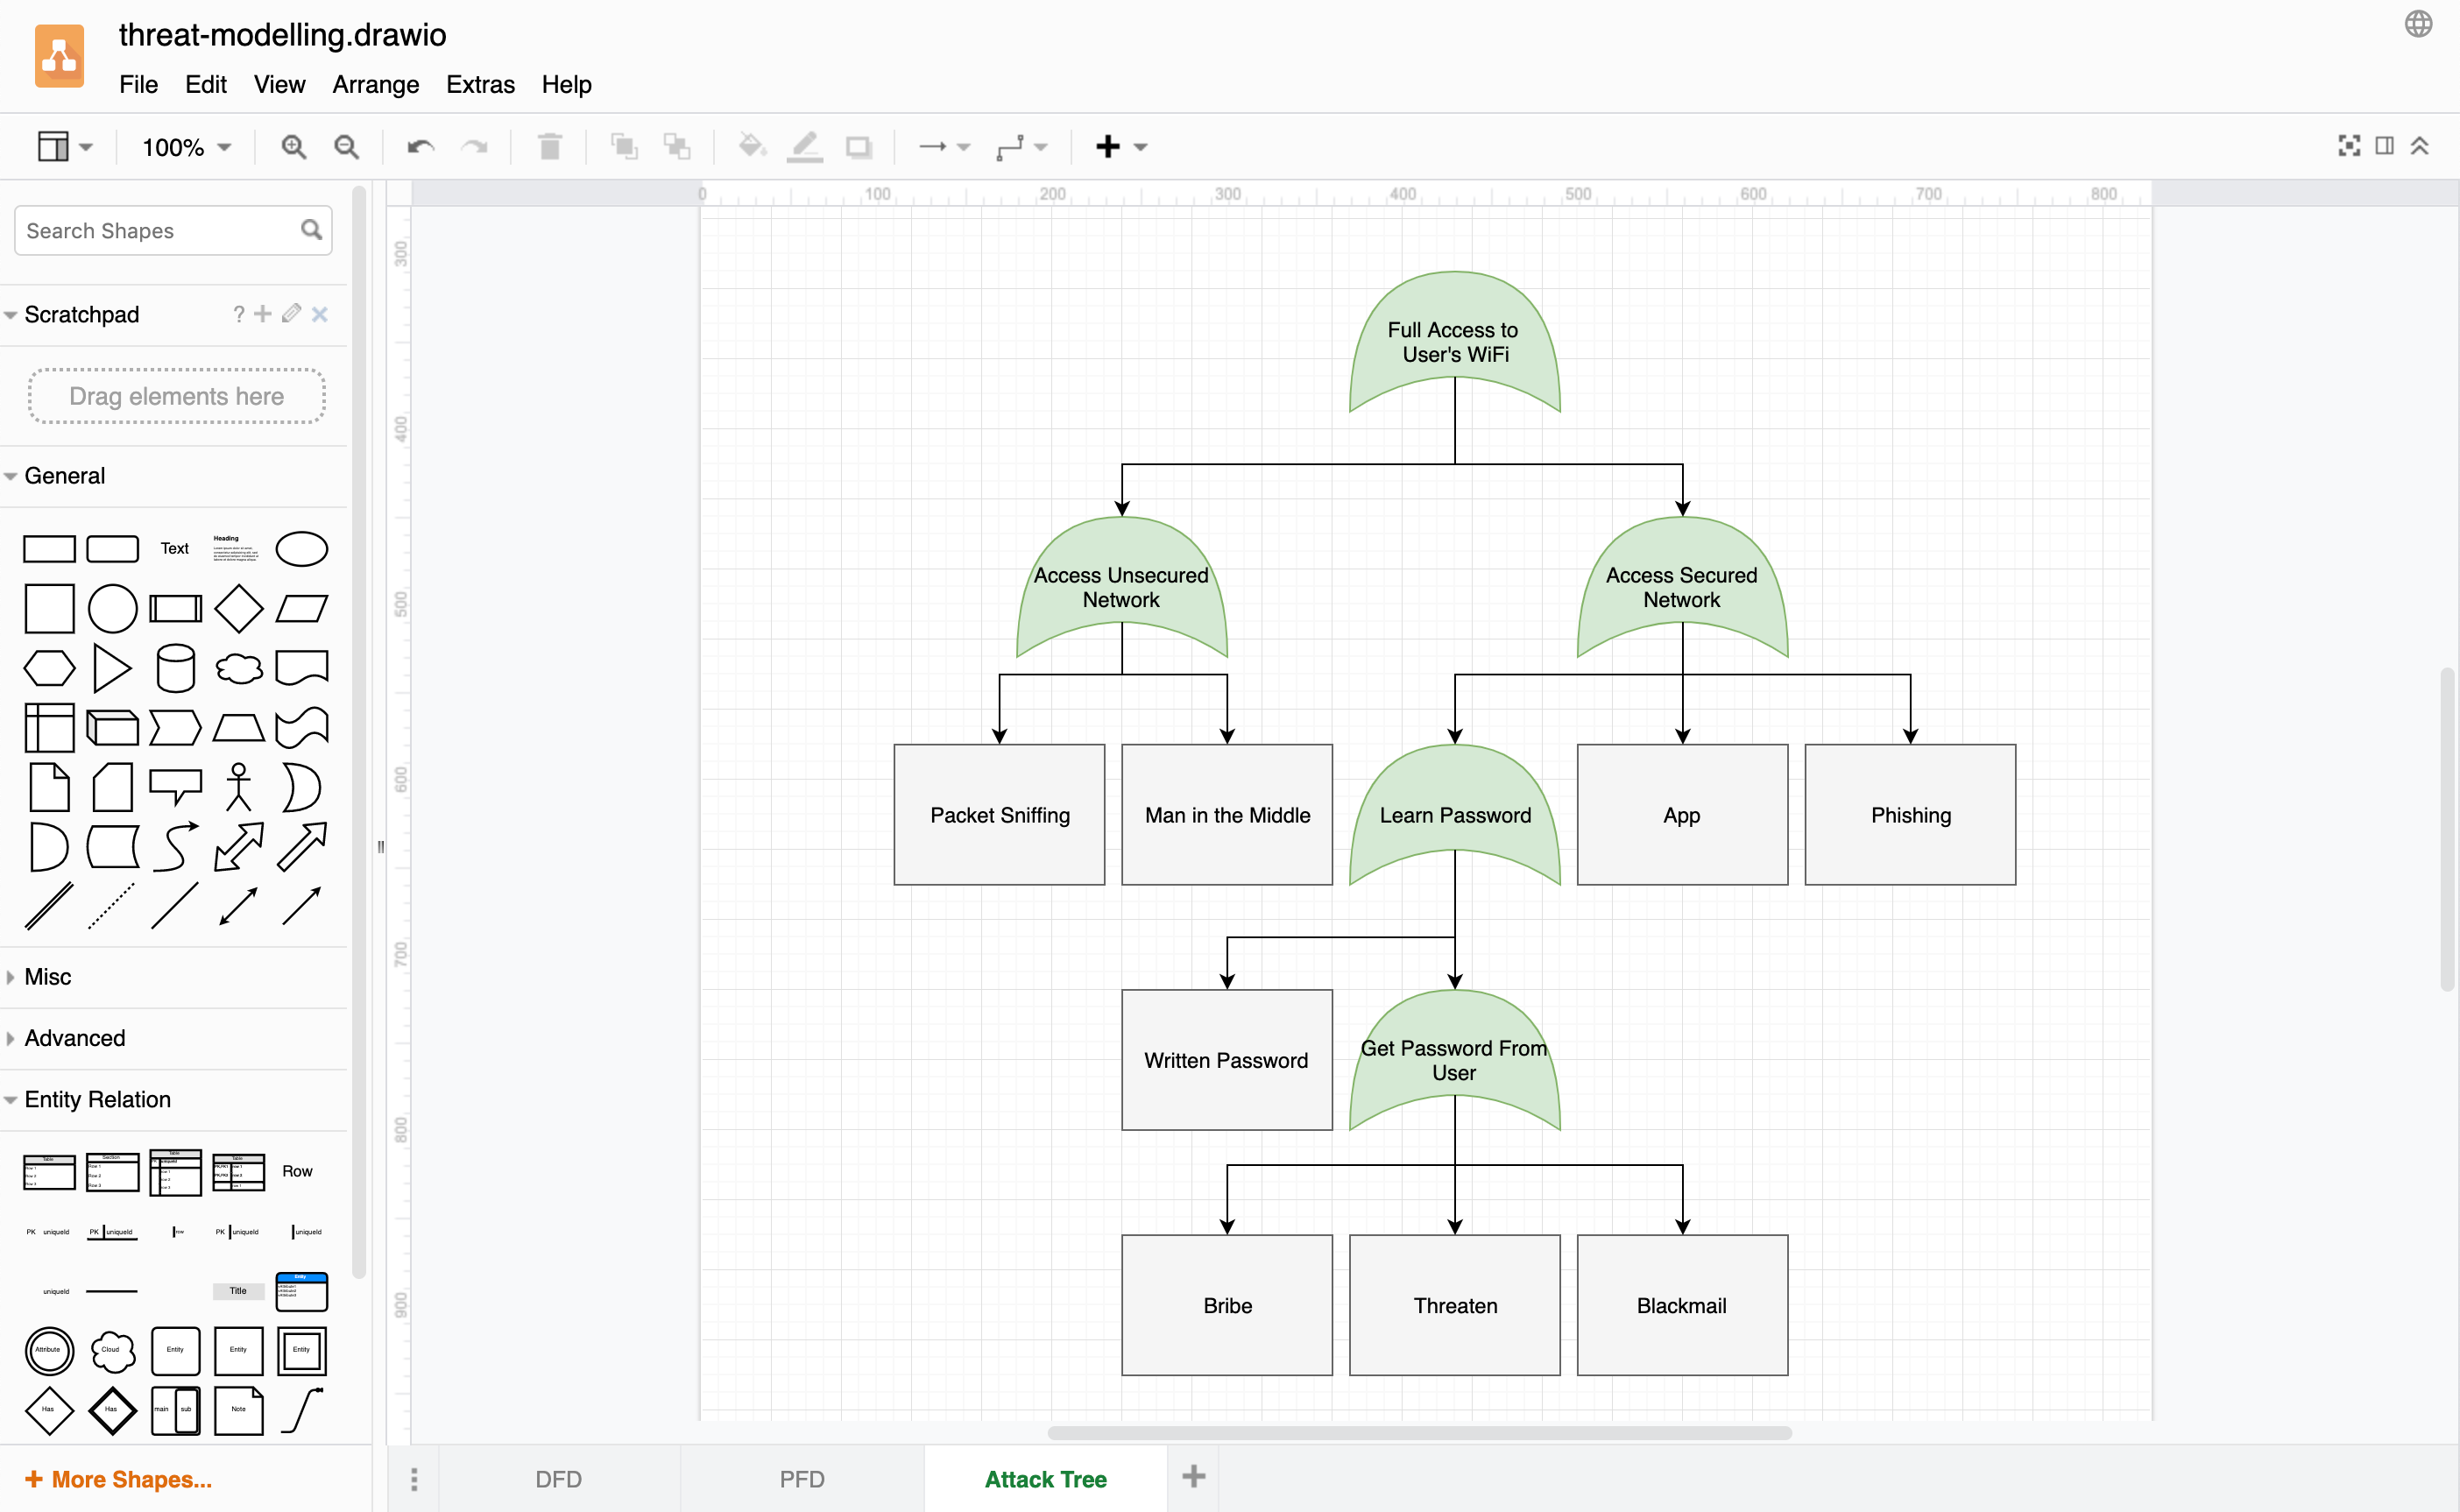
Attack trees
Hierarchical visualisations of one component or asset in your infrastructure allow you to explore how it might be attacked. They have been used for decades in the fields of defence and aerospace to analyse threats to their electronics systems, and are now becoming more popular in other fields. The lowest priority threats (with the least impact) are in the child leaf nodes, and the threats grow in priority as you traverse up through the parent nodes to the root of the tree.
Open all of these diagrams in our online diagram viewer
Enable the Threat Modeling shape library
Michael Henrikson developed a couple of custom libraries and explained why he likes to use draw.io for threat modelling. He has kindly given us permission to include his library in draw.io.
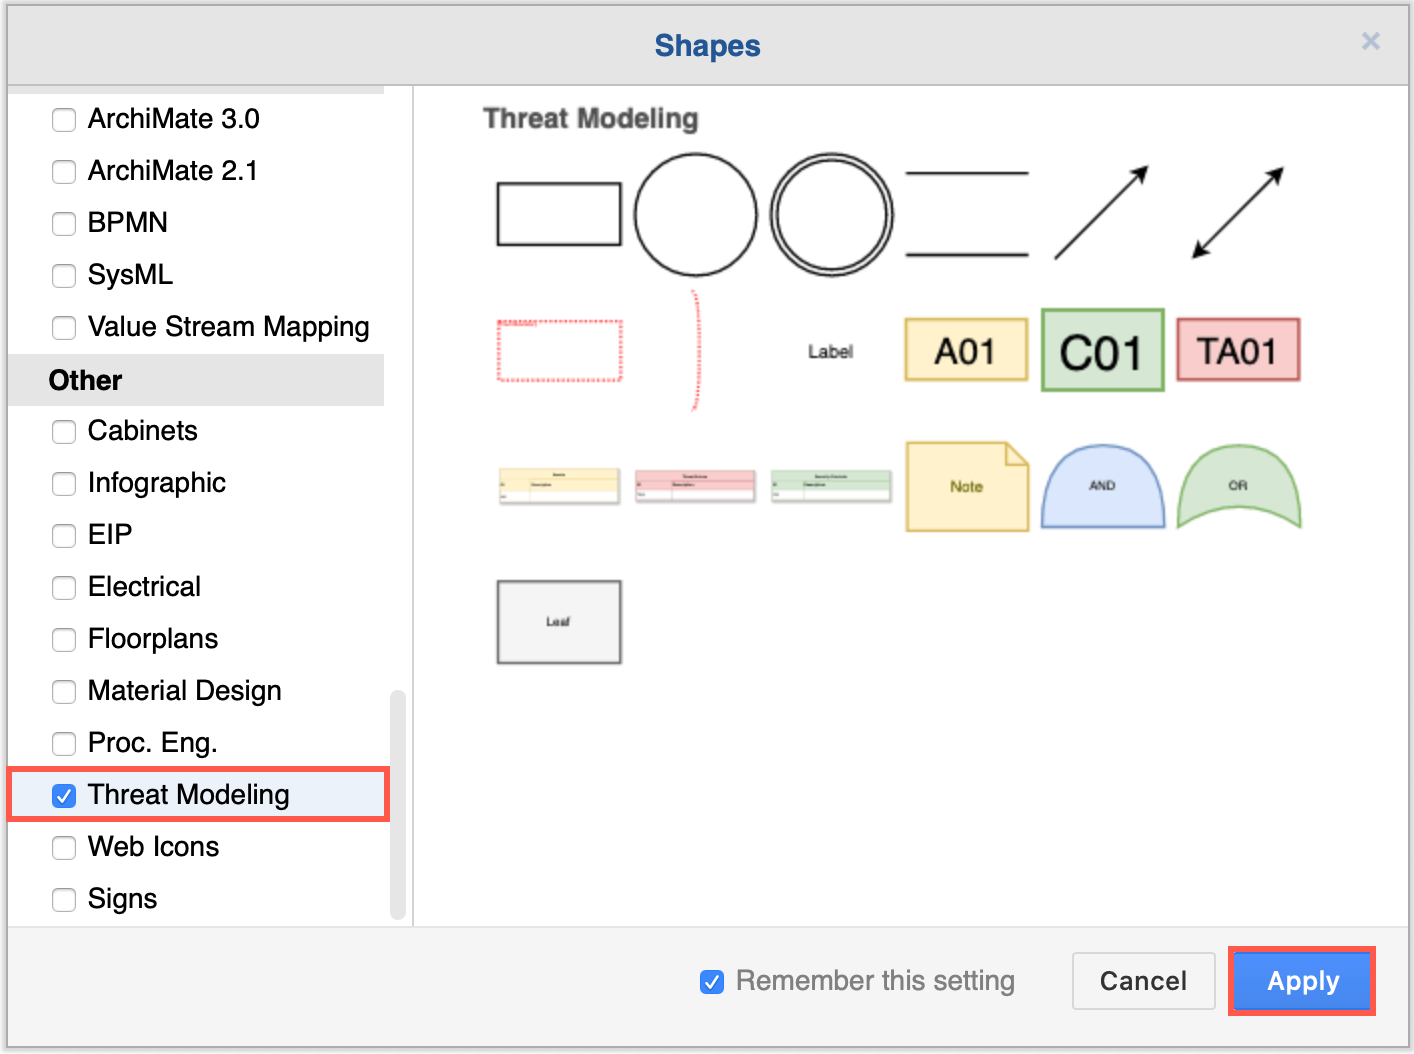
The shapes used to create these diagrams are now available in the threat modeling shape library.
- Click More Shapes at the bottom of the left panel.
- Scroll down to the Other section, enable the Threat Modeling shape library, then click Apply.
Use the draw.io desktop app for secure threat modelling
Because your threat modelling diagrams contain highly sensitive data about your applications and infrastructure, ensure they are secure and use the draw.io desktop app, available for Windows, macOS and Linux.
When you use the draw.io desktop app, your diagrams will be stored on your local device. Because this is a stand-alone application, also designed to run offline, there are no interfaces to cloud storage platforms available. Of course, you can still store your diagrams in folders that are synchronised to your cloud storage if you wish.
The desktop app can be used behind a strong firewall or even offline as there is no external communication of diagram data.