UML 2.5 shape library with updated shapes
The Unified Modeling Language (UML) is a set of standard symbols and diagram types, commonly used in data modelling, workflow visualisation, and system modelling. UML notation is the defacto industry standard in the fields of software development, IT infrastructure, business systems and other fields. Many languages, such as SysML, SoaML, and a number of architecture frameworks use and extend UML.
The UML 2.5 specification updated the notation, or the shapes used in diagrams so they could represent a wider range of concepts more clearly. The specification document was extensively rewritten to make it easier to understand.
No new diagram types were added in UML 2.5 - the 14 diagram types that were previously defined in UML 2.0 are extended to cover the additional concepts, with many examples provided in the specification document.
UML diagram types
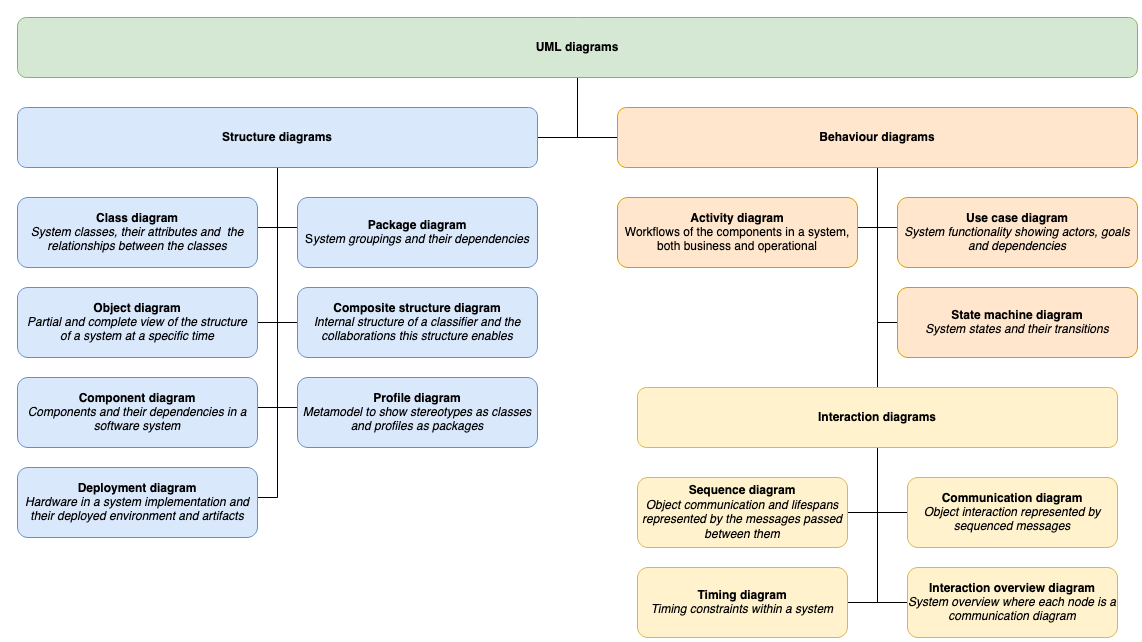
UML diagrams are divided into two categories that provide you with static (structural) and dynamic (behavioural) views of a system.
- Structure diagrams: Class diagrams, component diagrams, composite structure diagrams, deployment diagrams, object diagrams, package diagrams, and profile diagrams.
- Behaviour diagrams: Activity diagrams, use case diagrams, state machine diagrams, and the four types of interaction diagrams - sequence diagrams, communication (collaboration) diagrams, interaction overview diagrams and timing diagrams.
Open this in our free diagram viewer
Enable the UML 2.5 shape library
- Click on More Shapes at the bottom of the left panel in draw.io, scroll down and click on the checkbox next to the UML 2.5 shape library in the Software section. You may want to also enable the UML shape library. Then click Apply.
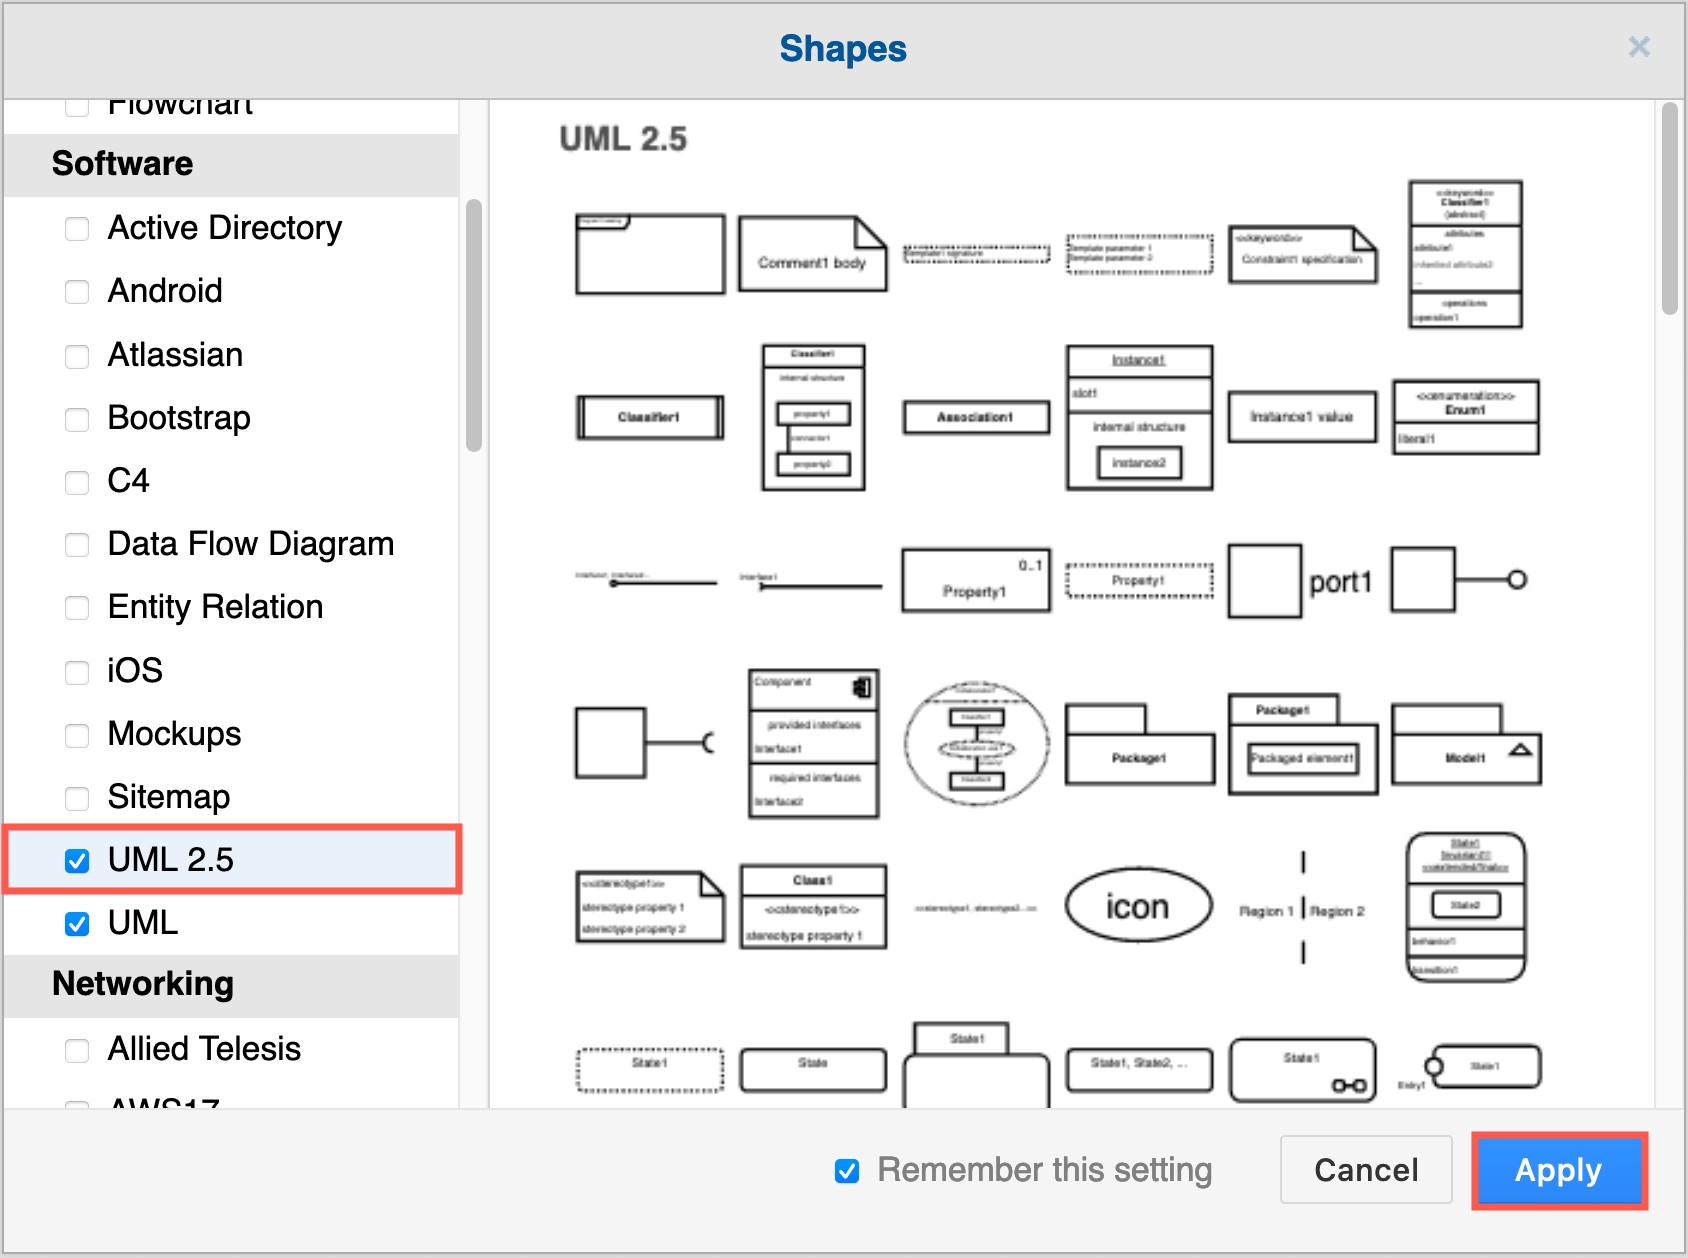
- The UML 2.5 shape library will appear in the left panel.
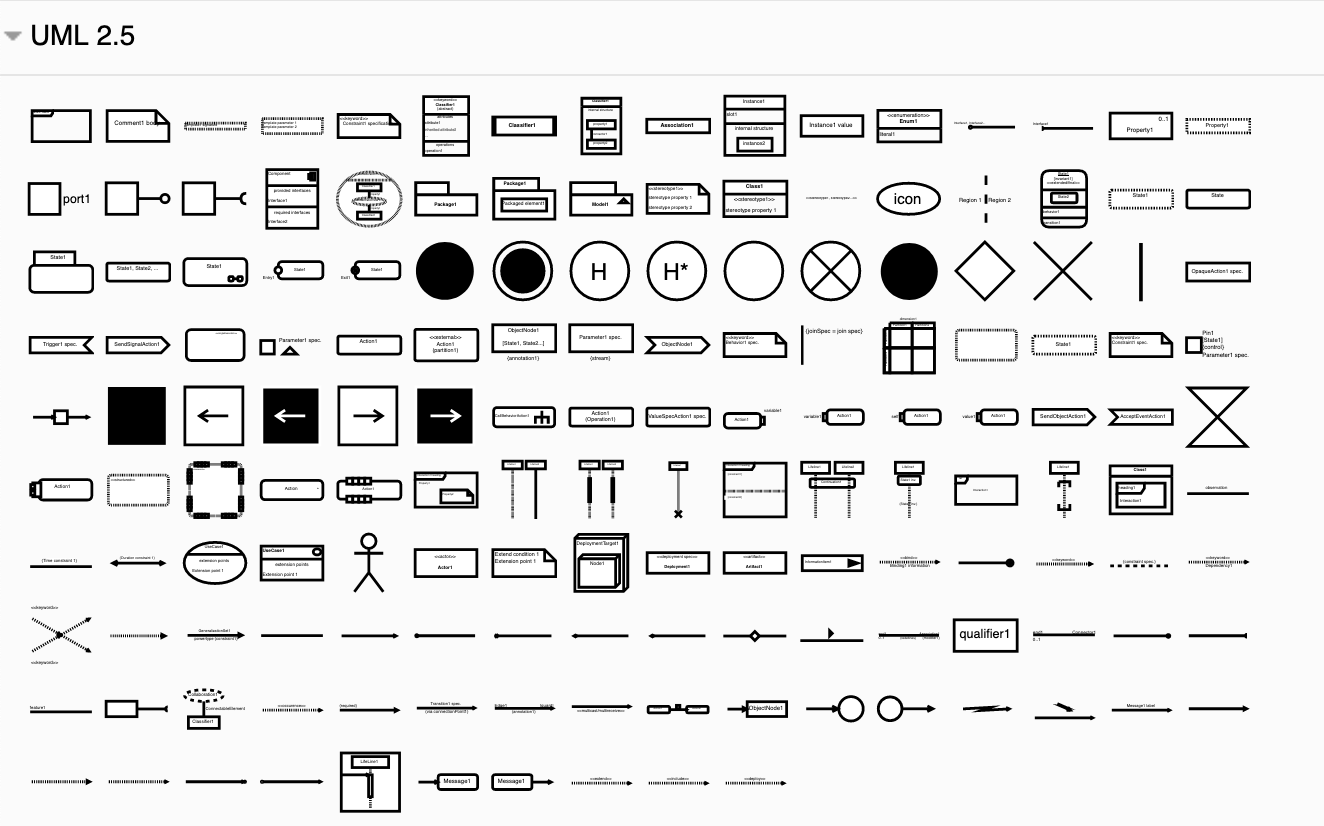
Using these shapes, and some of the shapes from the General and older UML shape libraries, you can create the full range of UML diagrams.
Example UML diagrams
Click on a diagram below to open in our diagram viewer
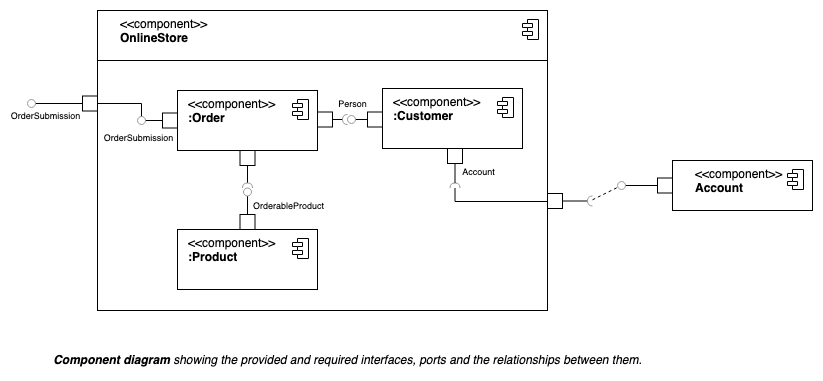
Component diagrams show the dependencies between the logical and physical components of a system with the interfaces that each component requires and provides and their ports.
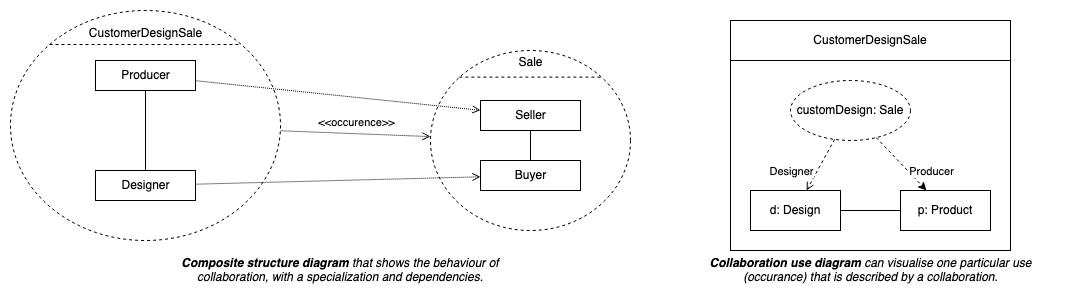
Composite structure diagrams are used to show the internal structure of a classifier, with its properties, parts and relationships, or how a collaboration behaves. You can break down the behaviour of a collaboration into one or more specific situations (occurences) in a collaboration or collaboration use diagram.
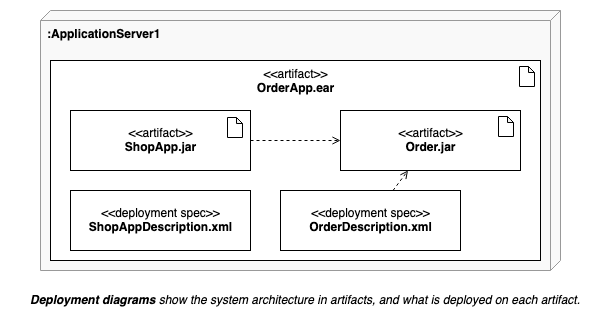
Deployment diagrams shows the system infrastructure and how various software executables and artifacts are deployed on deployment targets.
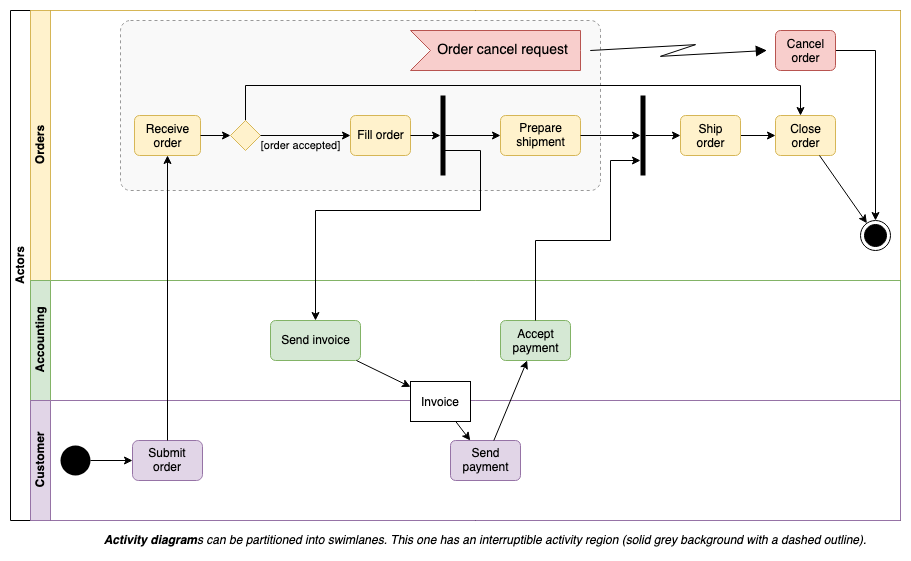
Activity diagrams are used to model workflows in various ways. In this example, the workflow actions are arranged into swimlanes representing the actors, with a section that allows an interrupt (exception) to cancel the order.