Technical diagrams for manufacturing - process engineering shape library
In draw.io, the wide range of shape libraries let you draw many kinds of technical diagrams. The large process engineering shape library (Proc. Eng.) helps you visualise manufacturing processes and production lines. This library also includes various ISO shapes should you need to diagram to specific standards.
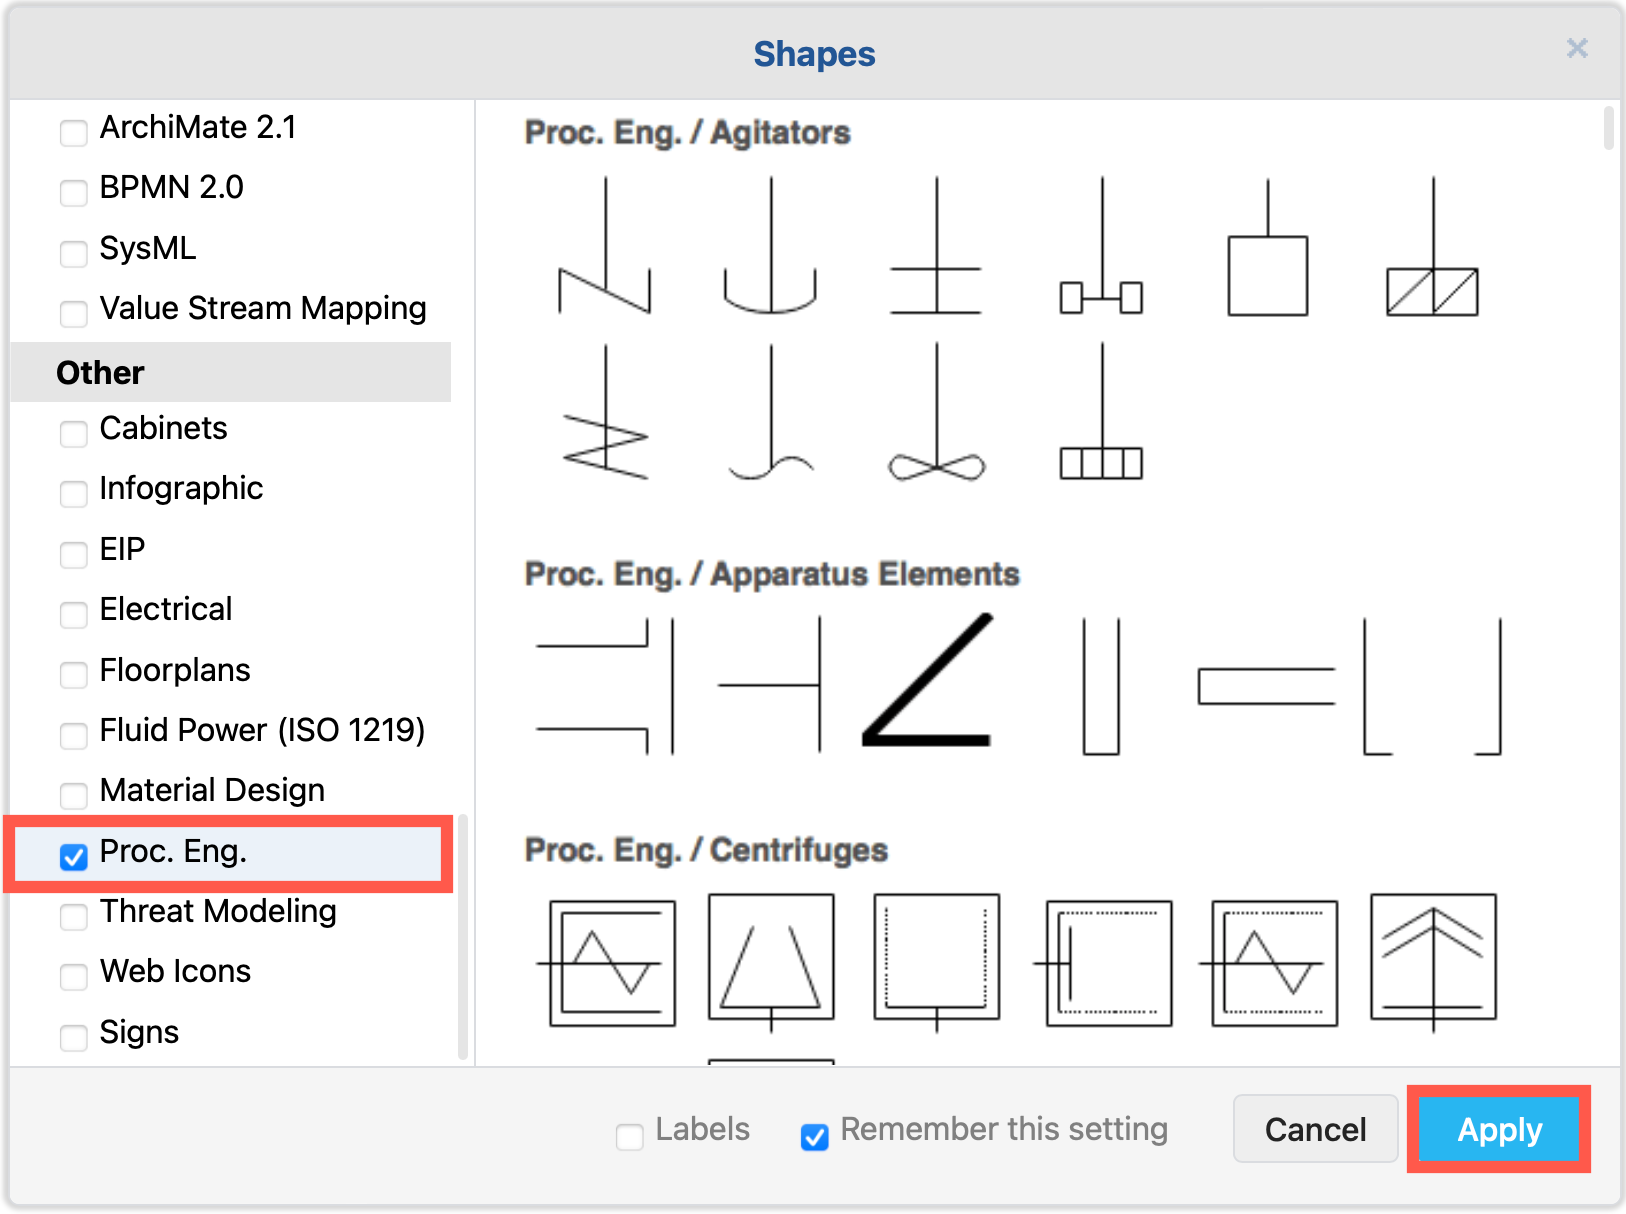
Enable the process engineering shape library
- In the draw.io editor, click More Shapes at the bottom of the left panel.
- Scroll down, and enable the Proc. Eng. shape library check box, then click Apply.
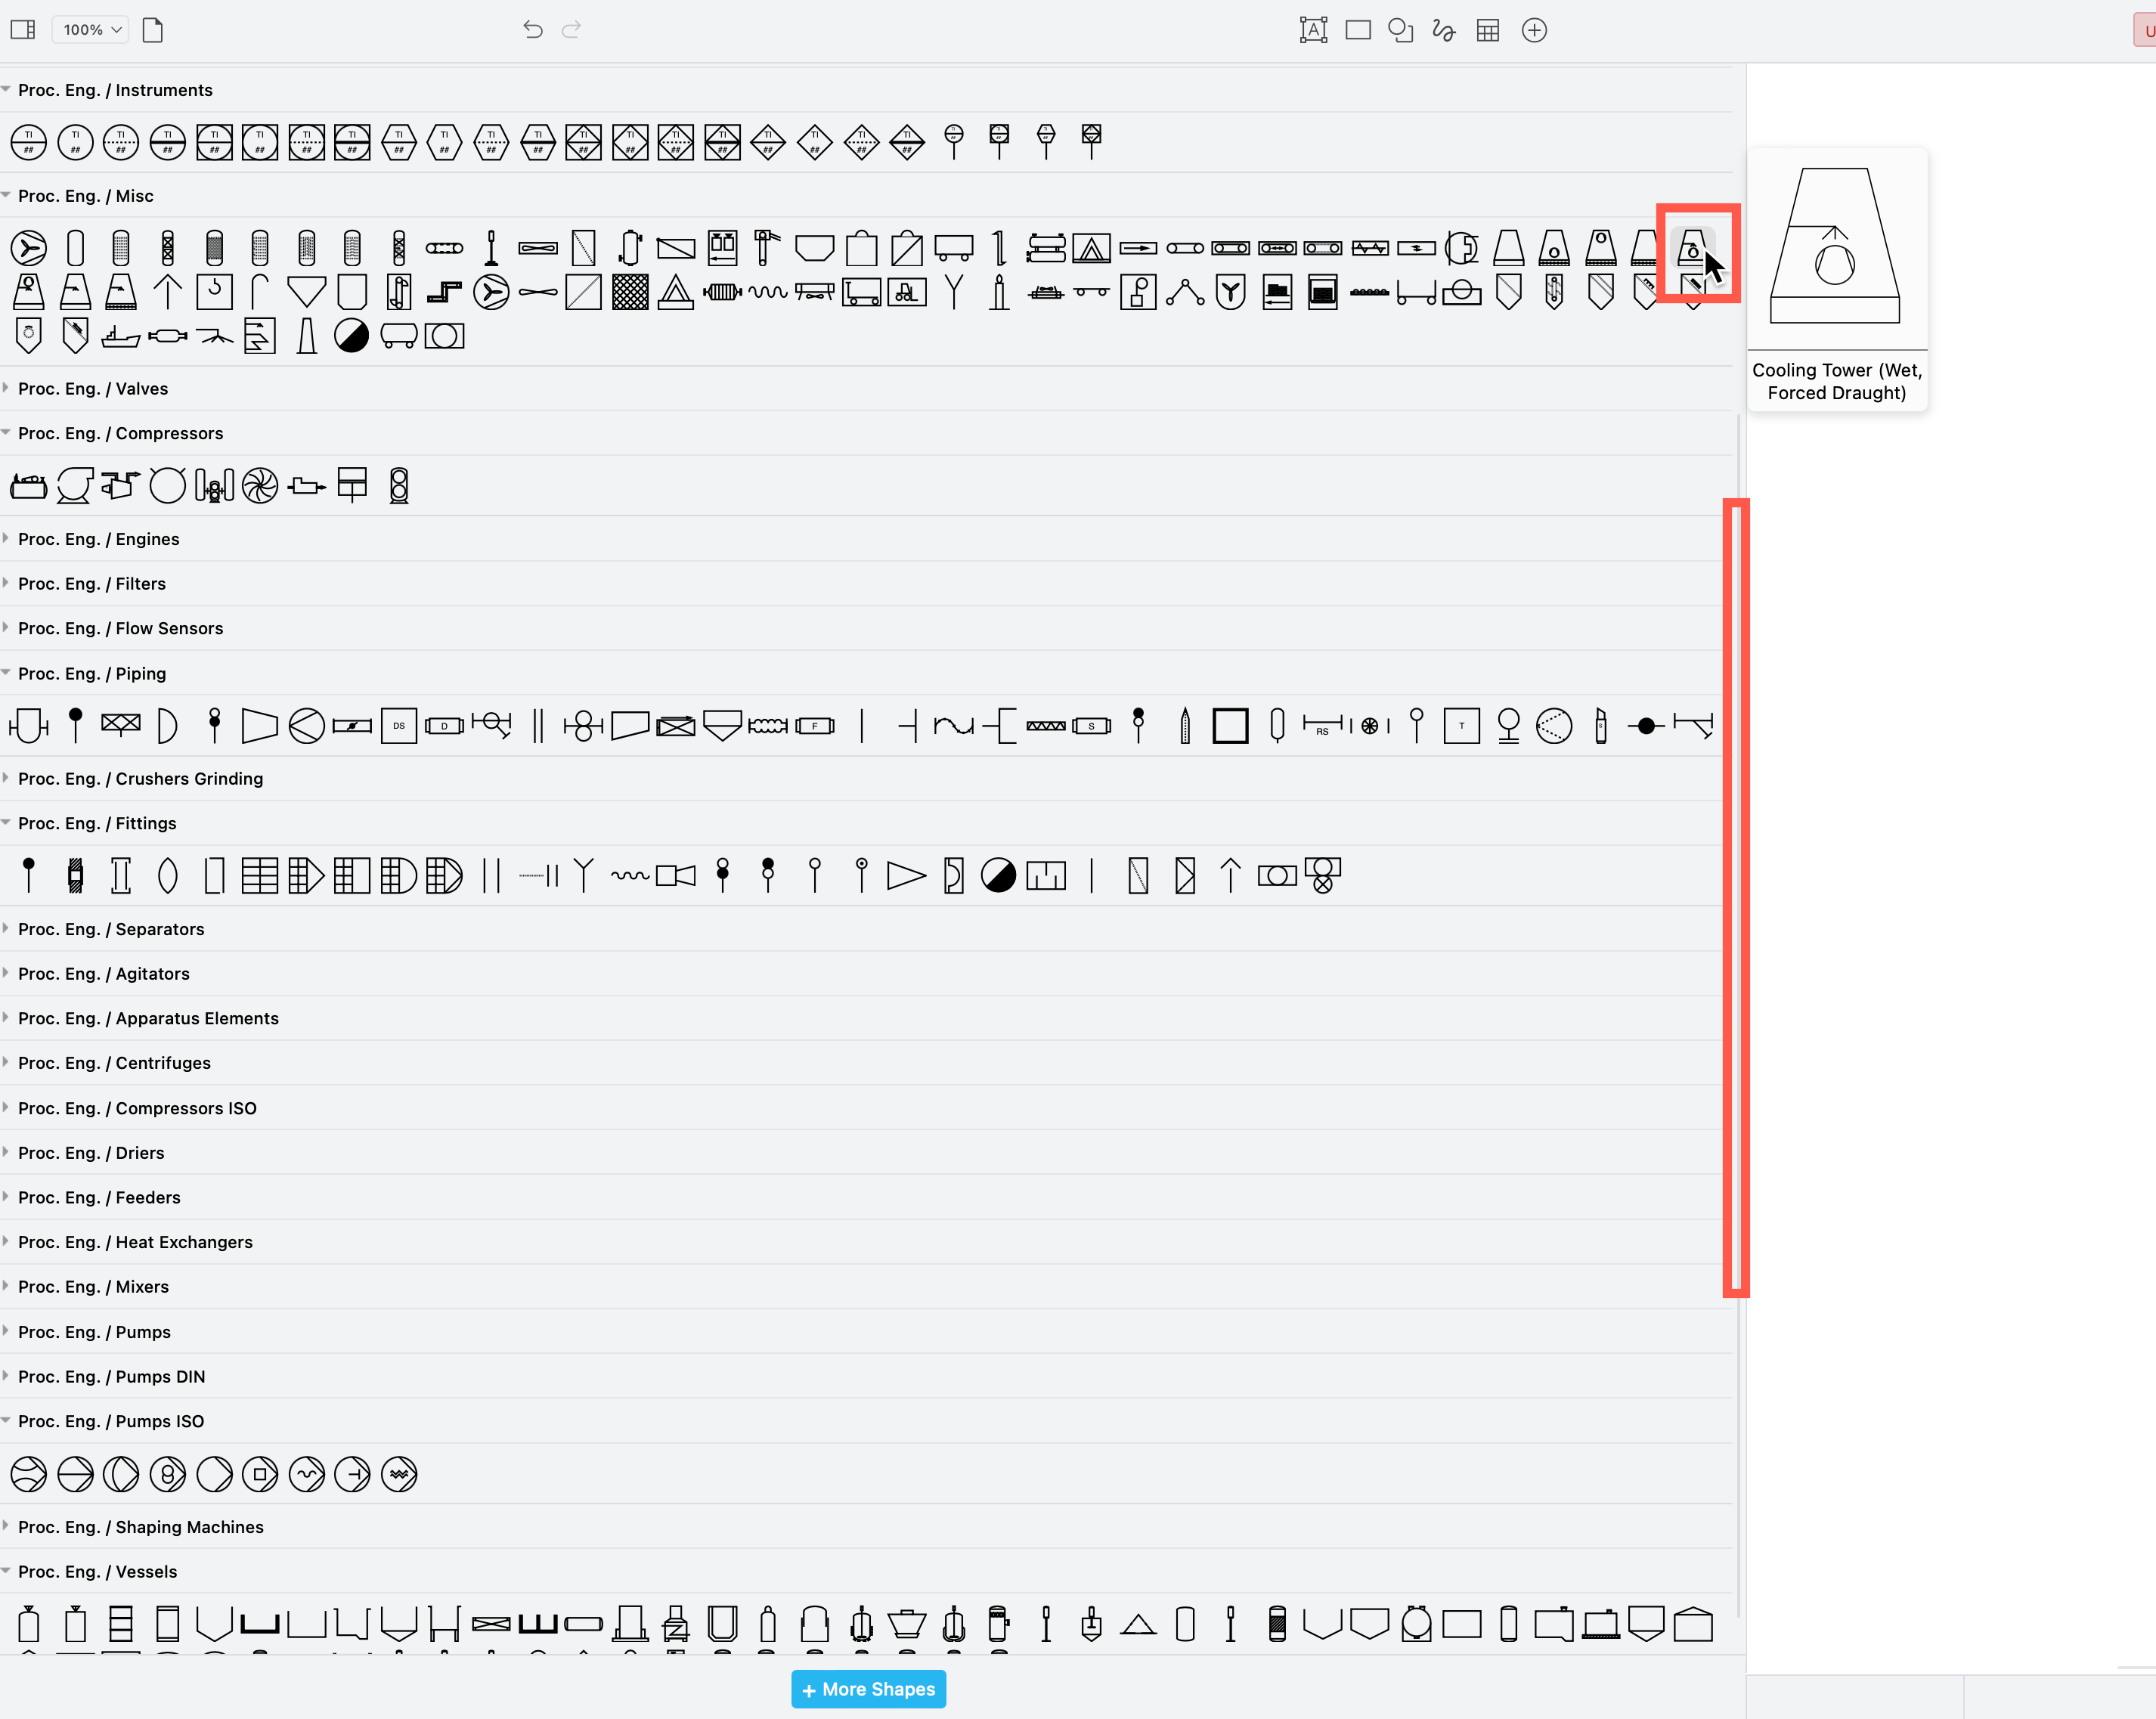
There are many shapes in the process engineering library, divided into themed sub-libraries.
- Expand the shape panel by dragging the right edge.
- Click on a sub-library heading to expand or collapse it.
- Hover over any shape to see a larger preview with its name underneath.
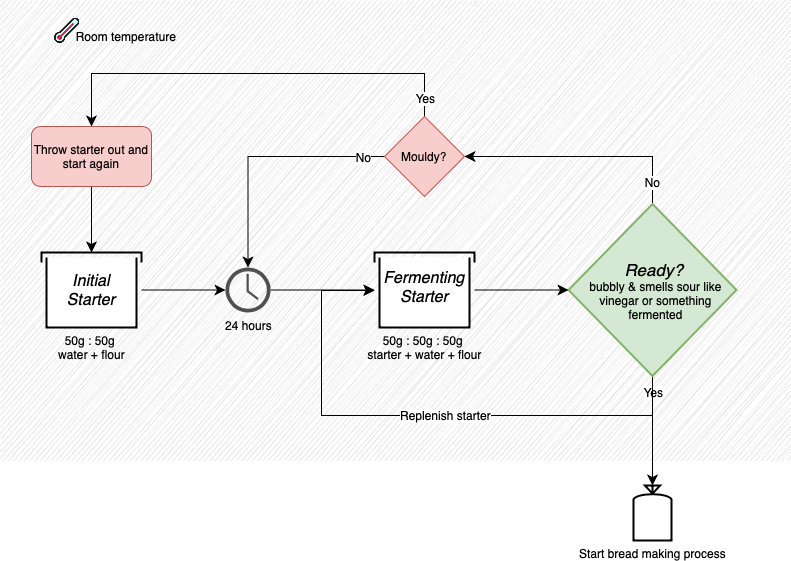
Draw a simple process flow - growing a sourdough starter
While this process is for a single loaf, it uses the same shapes from the Proc. Eng. shape library that you can use when modelling a sourdough loaf production line.
Basic process: A sourdough starter must be grown before baking a loaf of sourdough bread. It’s not an exact process. This is best visualised by combining typical simple flow chart shapes with the process engineering vessel shapes.
Tooltips: Add extra information that appears when you hover over a shape with a tooltip. Right-click on a shape and select Edit Tooltip from the context menu to add a tooltip.
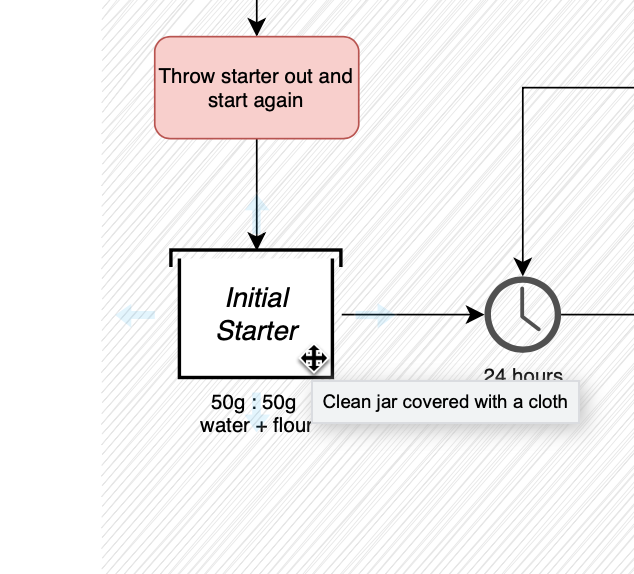
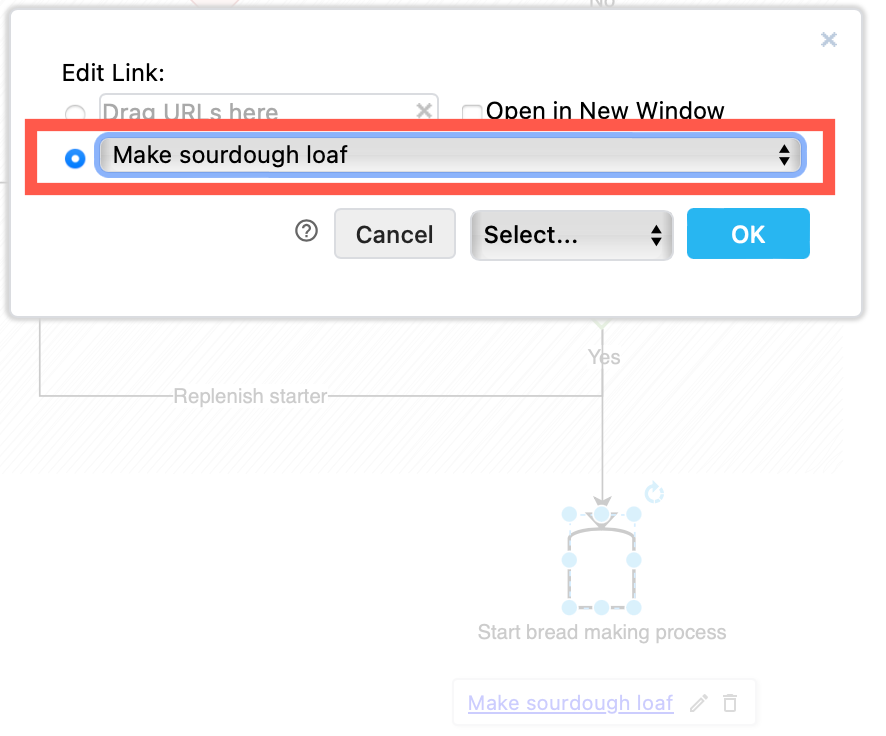
Links: If there is a step in your process that is complex, draw it on another page in a multi-page diagram. Right-click on the shape that represents the sub-process and select Edit Link from the context menu. Choose the diagram page from the dropdown list that you want to link to, and click OK.
When you hover over a shape with a link, it will appear as a tooltip - click on this to jump to that diagram page.
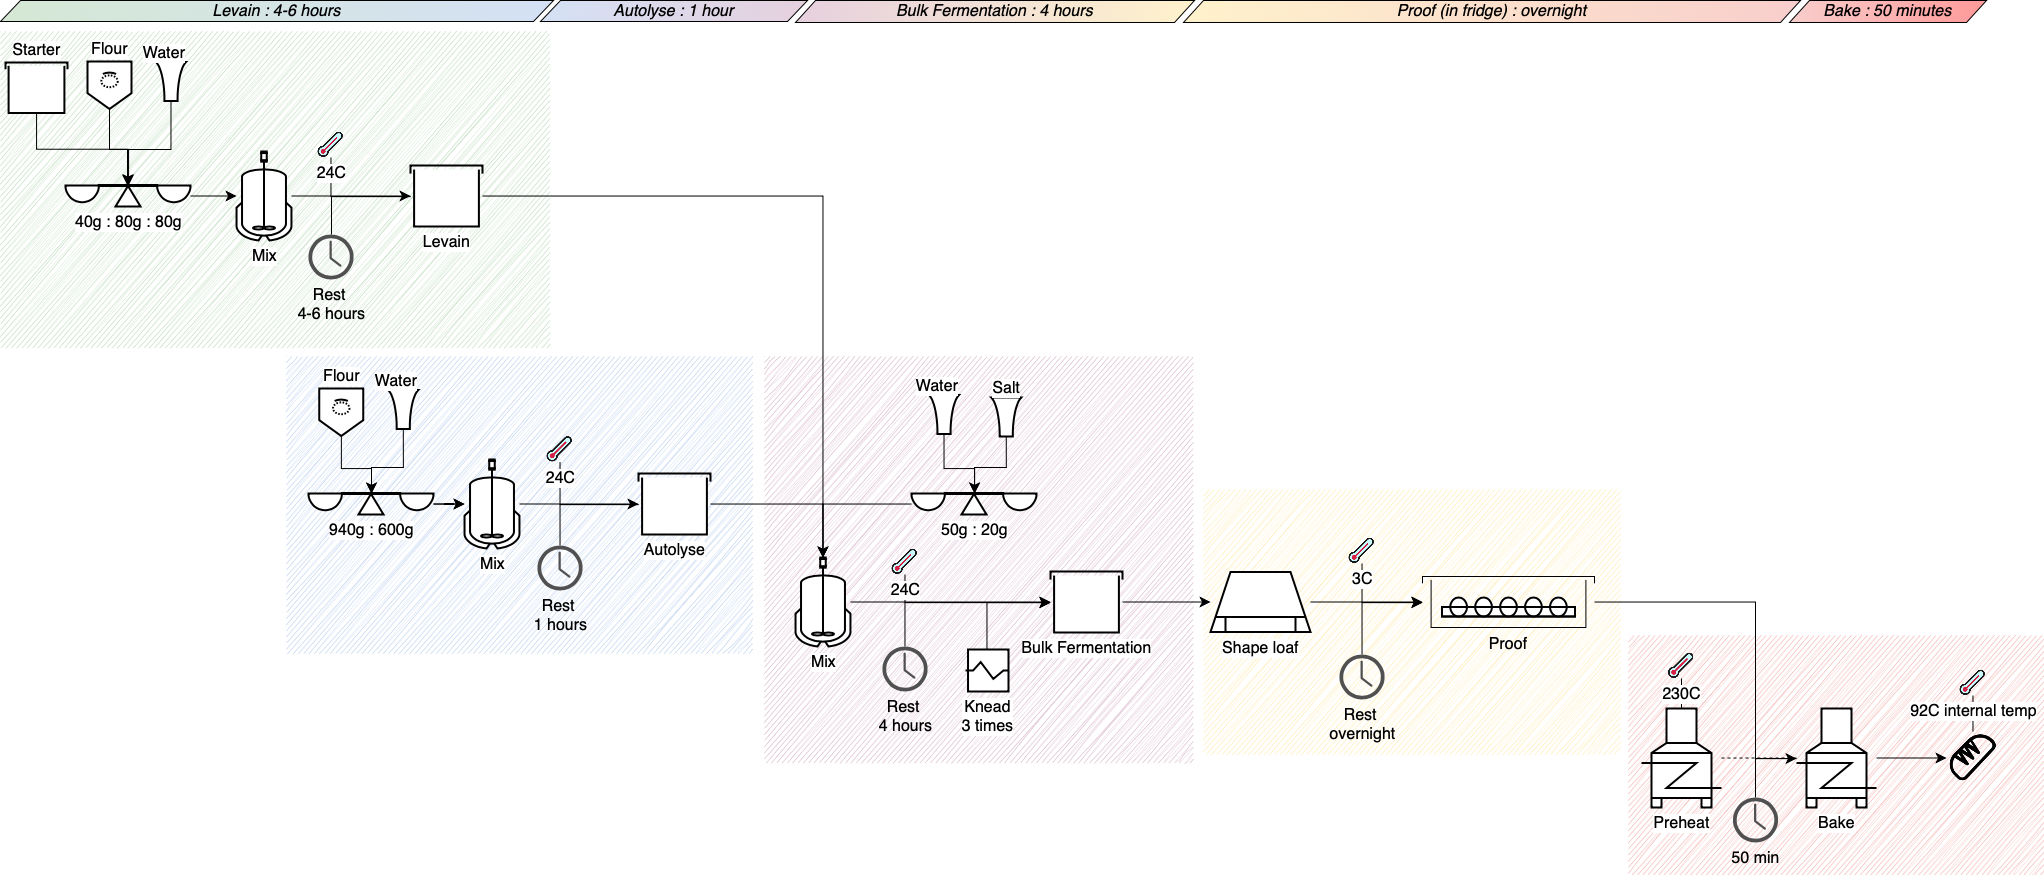
Draw a manufacturing process - baking a sourdough loaf
There are many steps involved in preparing a sourdough loaf made without yeast - various mixtures need to wait for various lengths of times at specific temperatures to get a good loaf of bread.
Open this example in the draw.io diagram viewer
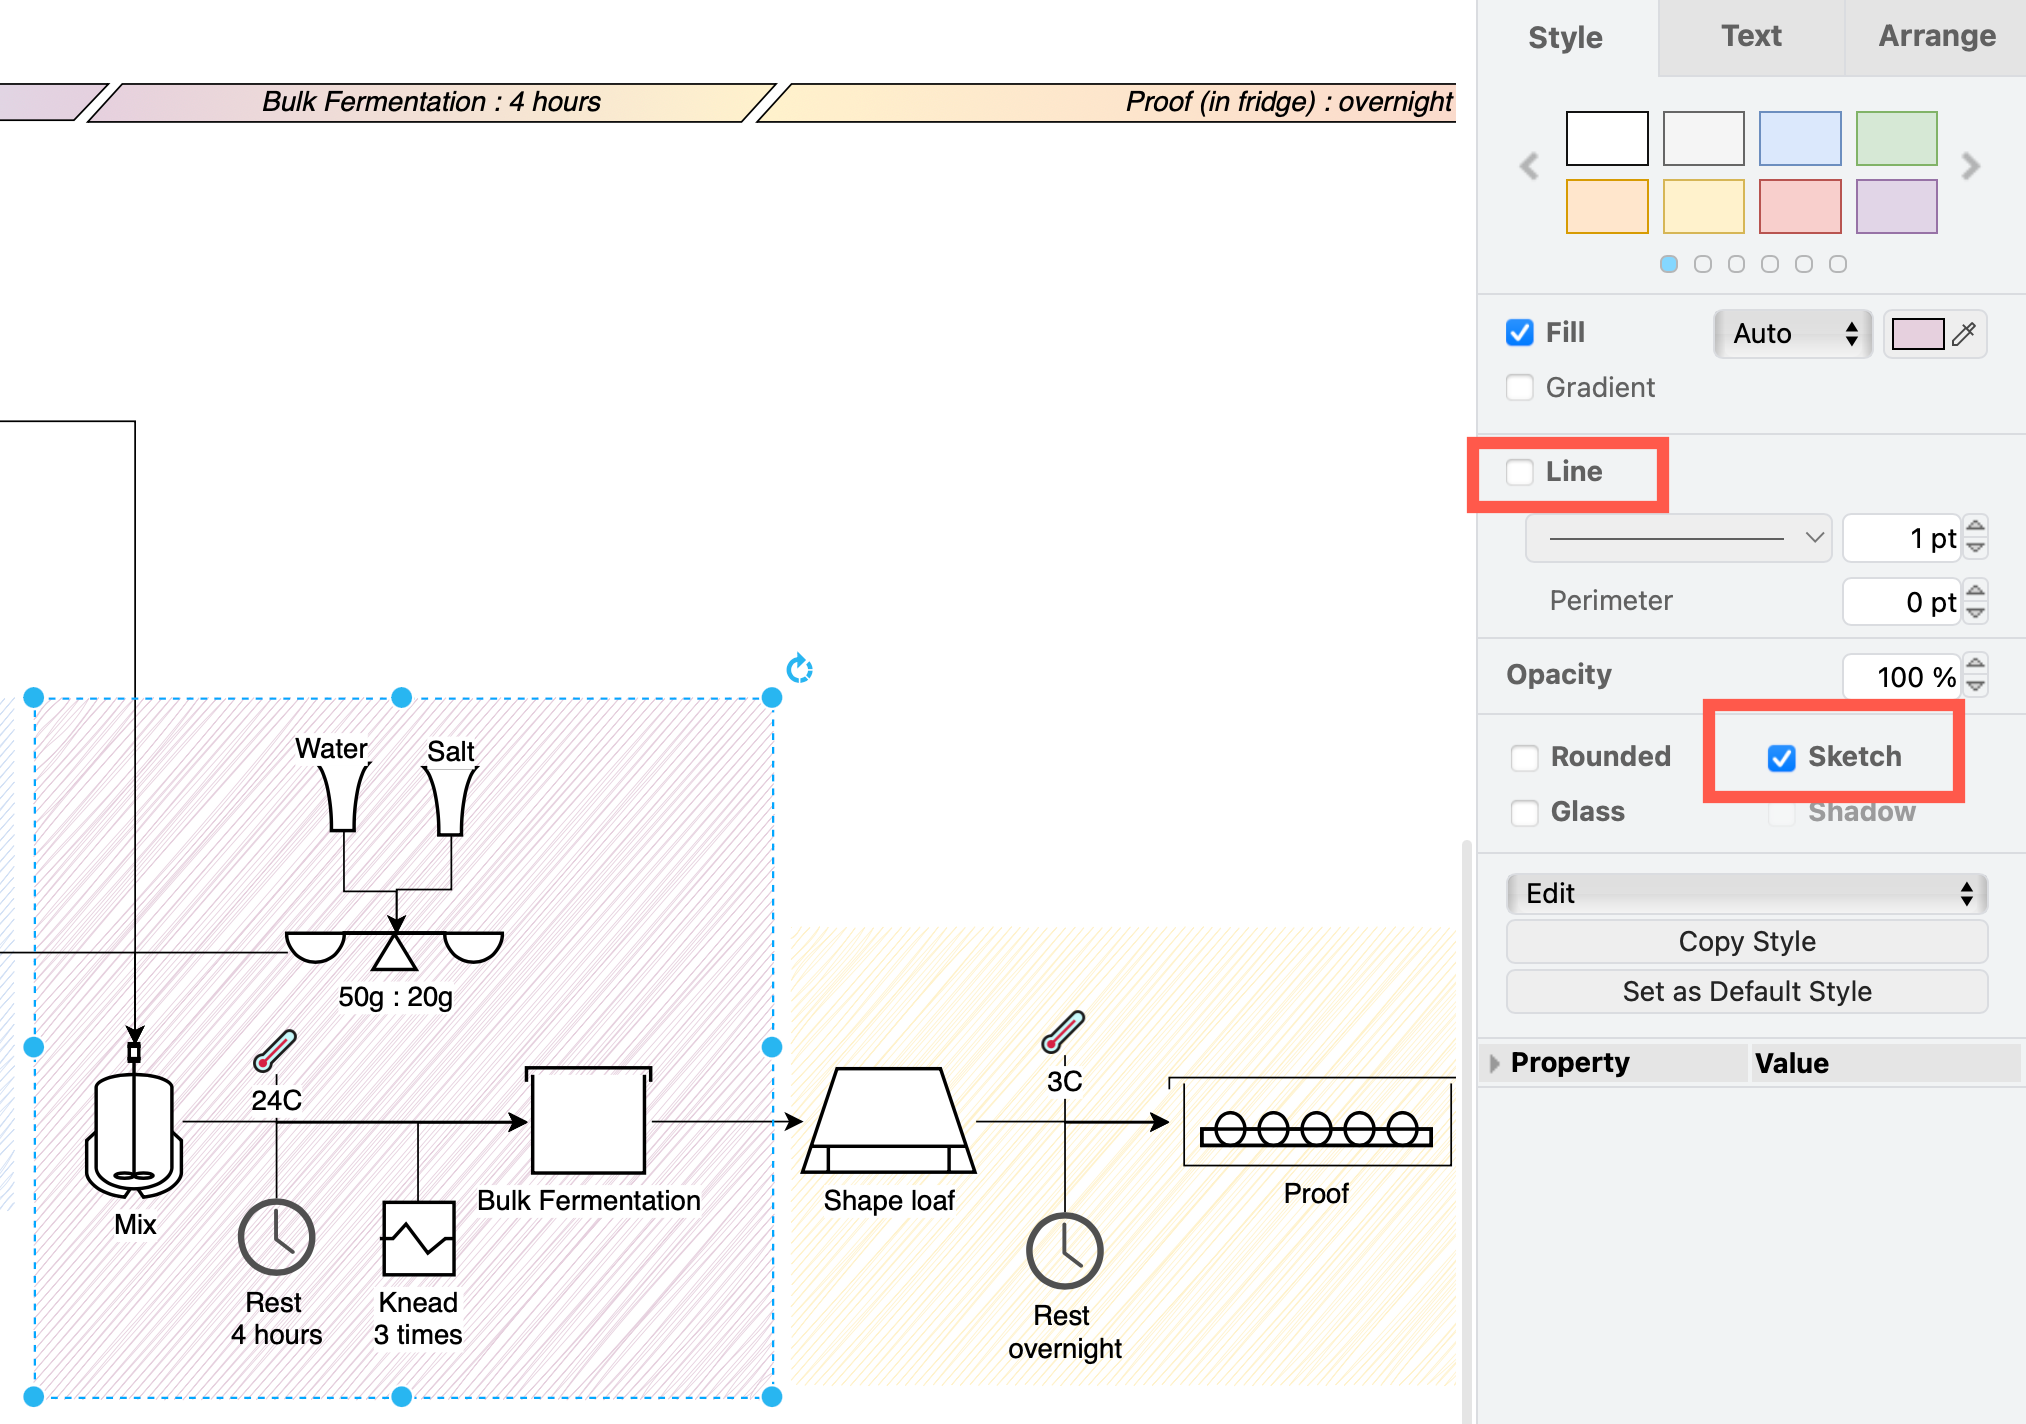
In the example above, a timeline - simple parallelogram shapes with a gradient fill - is drawn across the top of the diagram to provide an overview.
Regions are indicated with sketch-style rectangles. Regions can be used to indicate the steps done at a particular station in a production line.
- Add a rectangle shape, right-click on it and send it to the back behind the other shapes to make it a background.
- Select Sketch in the format panel and deselect Line so it doesn’t overwhelm the process steps in your diagram.
Note that the Starter shape links back to the simple process on page one of this multi-page diagram.
Use technical diagrams to monitor manufacturing processes
Process engineering diagrams are useful for dashboards, to monitor stations in the manufacturing process.
- Export the diagram as a PNG to use as the dashboard background.
- Export individual shapes that you want to re-colour in your dashboard as an SVG file.
- Edit the SVG file in a text editor, and replace the
strokeandfillvalues with a question mark to convert their values to something unknown. - Now you can use the background diagram of your production line and the SVGs of individual stations with a tool such as Grafana Canvas to craft a real-time updating dashboard to monitor your manufacturing process.