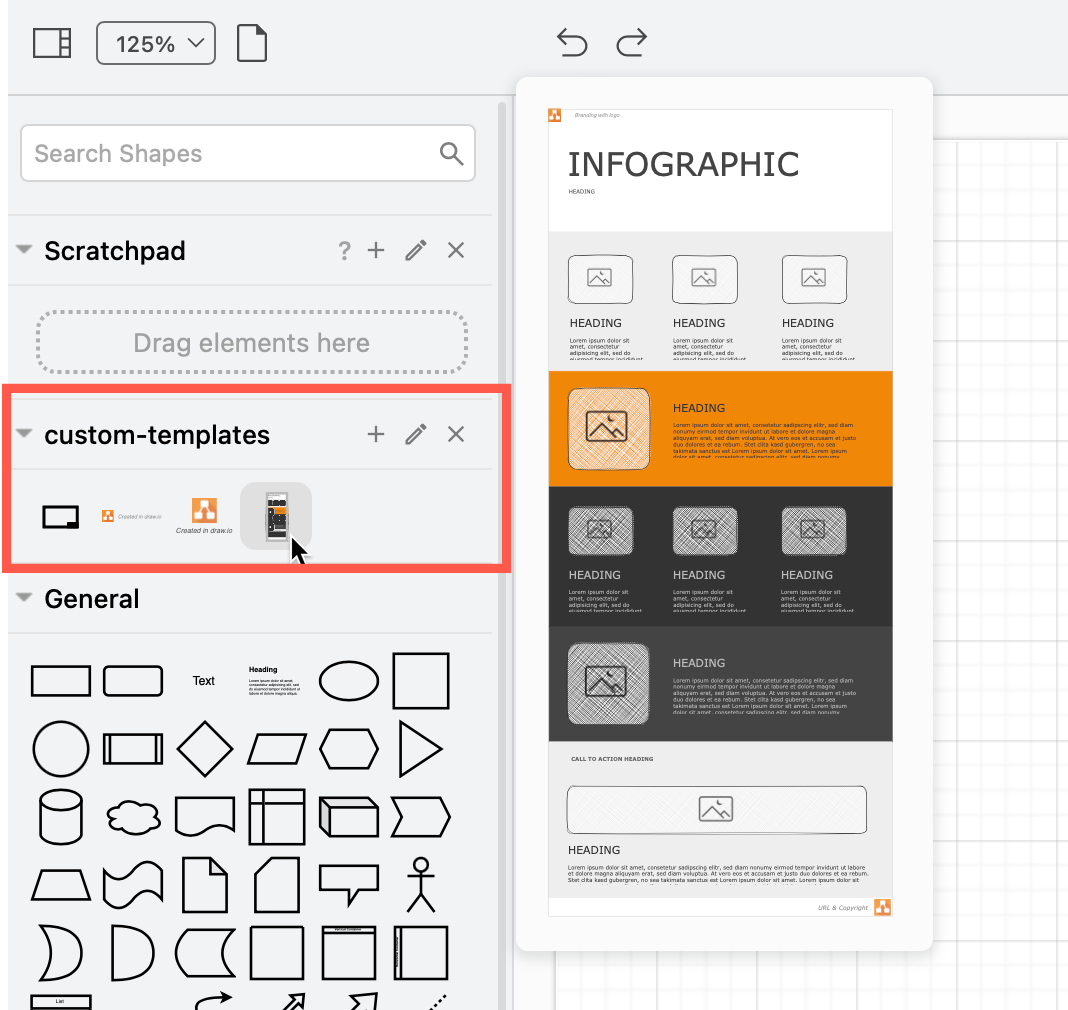
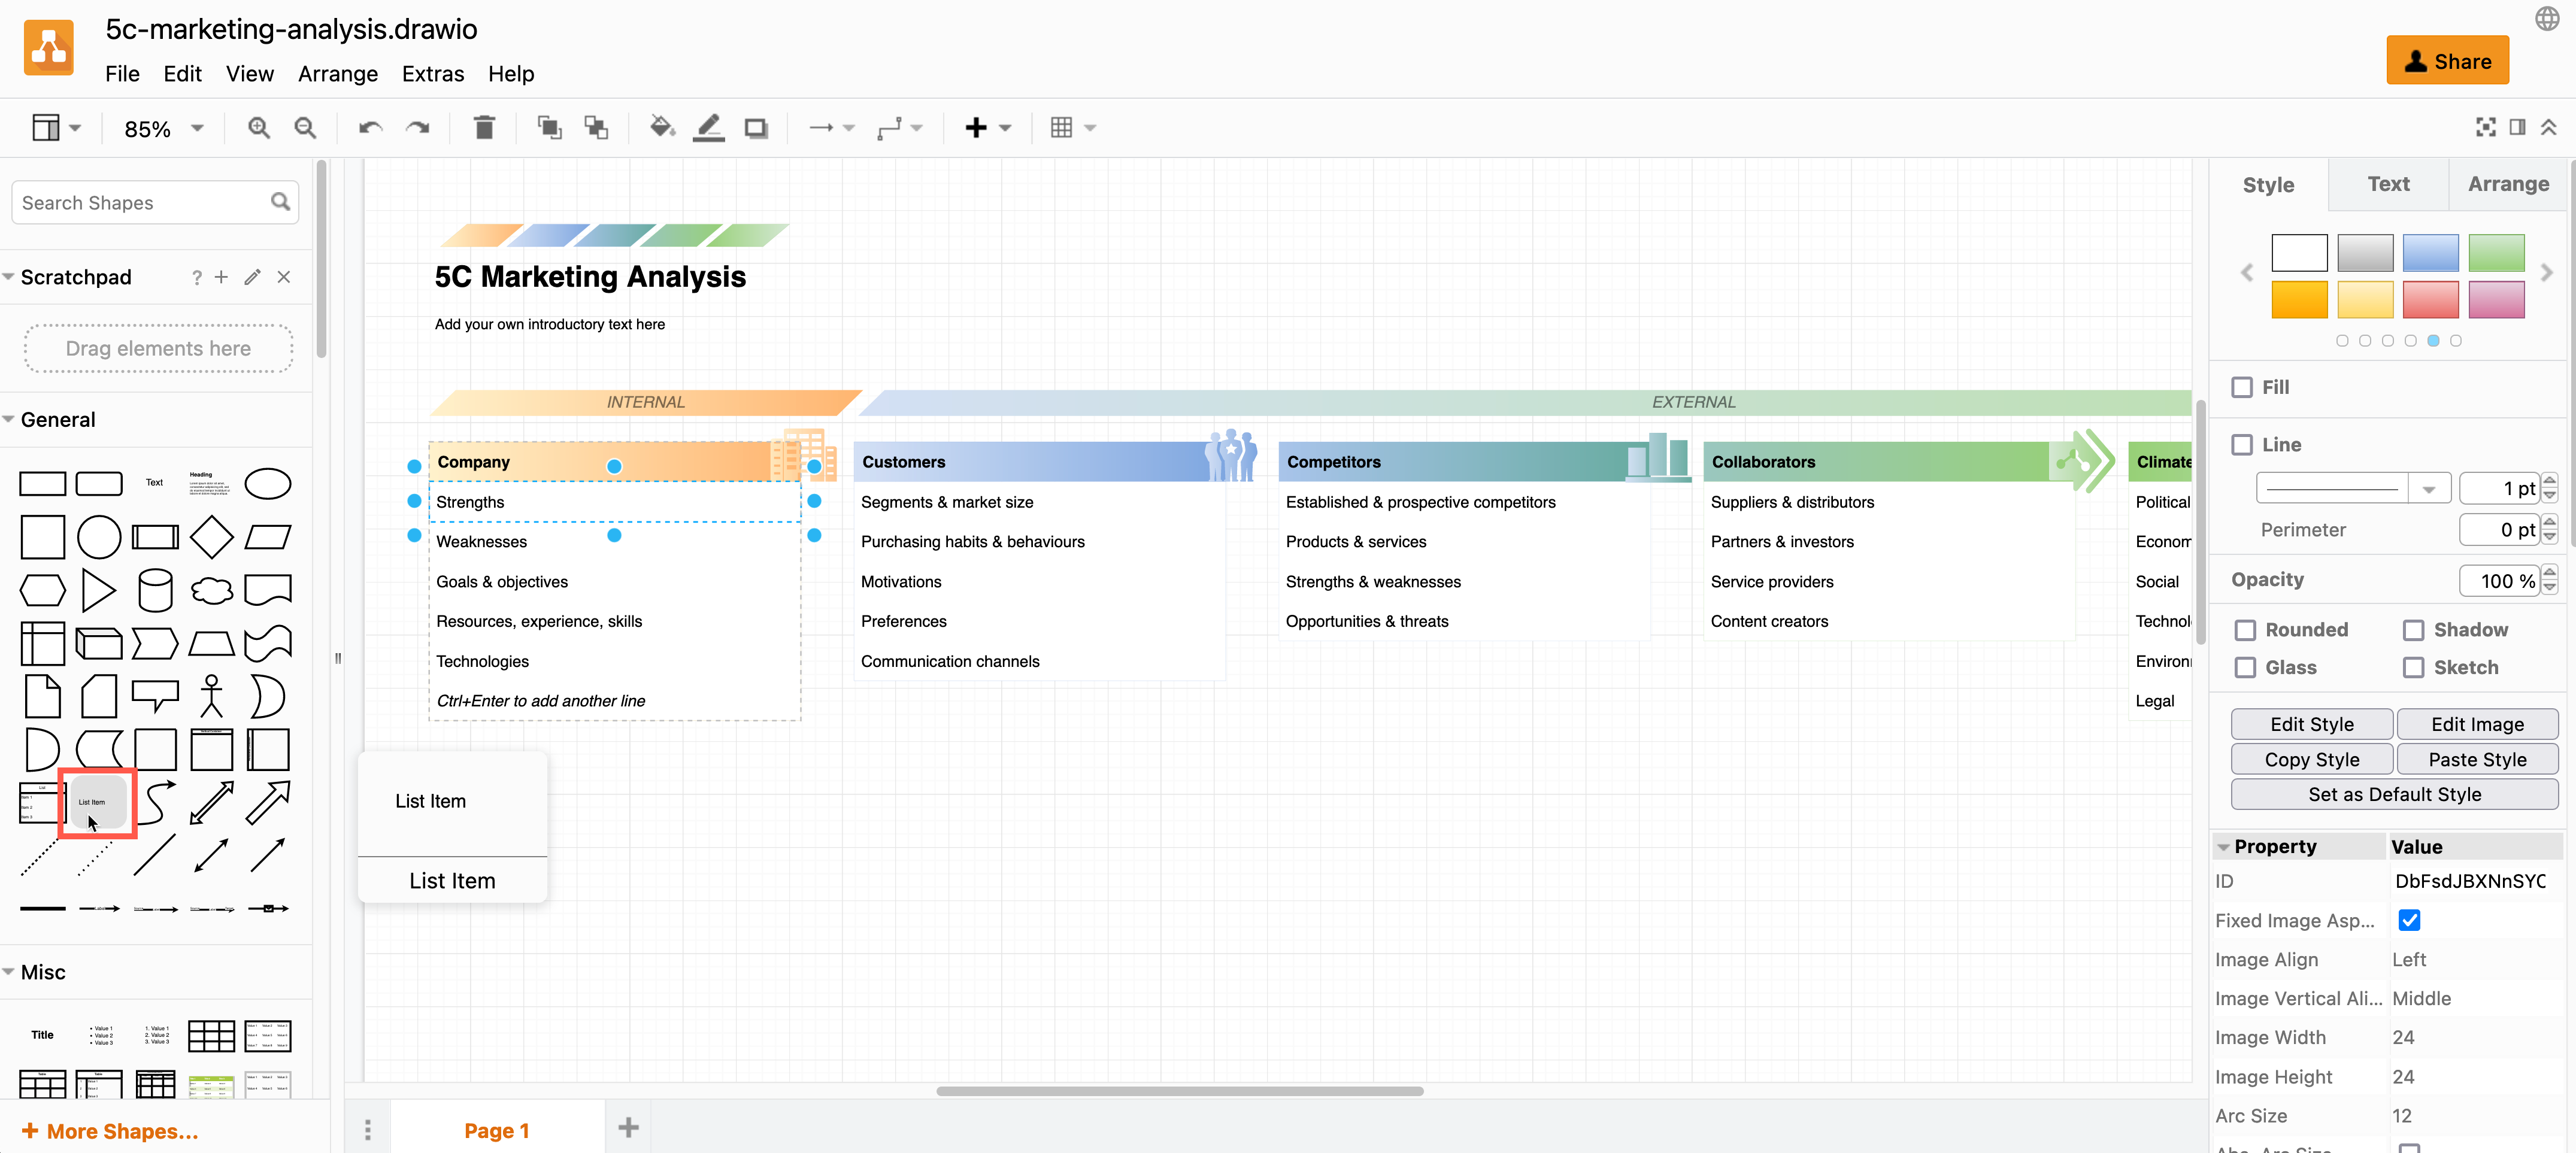
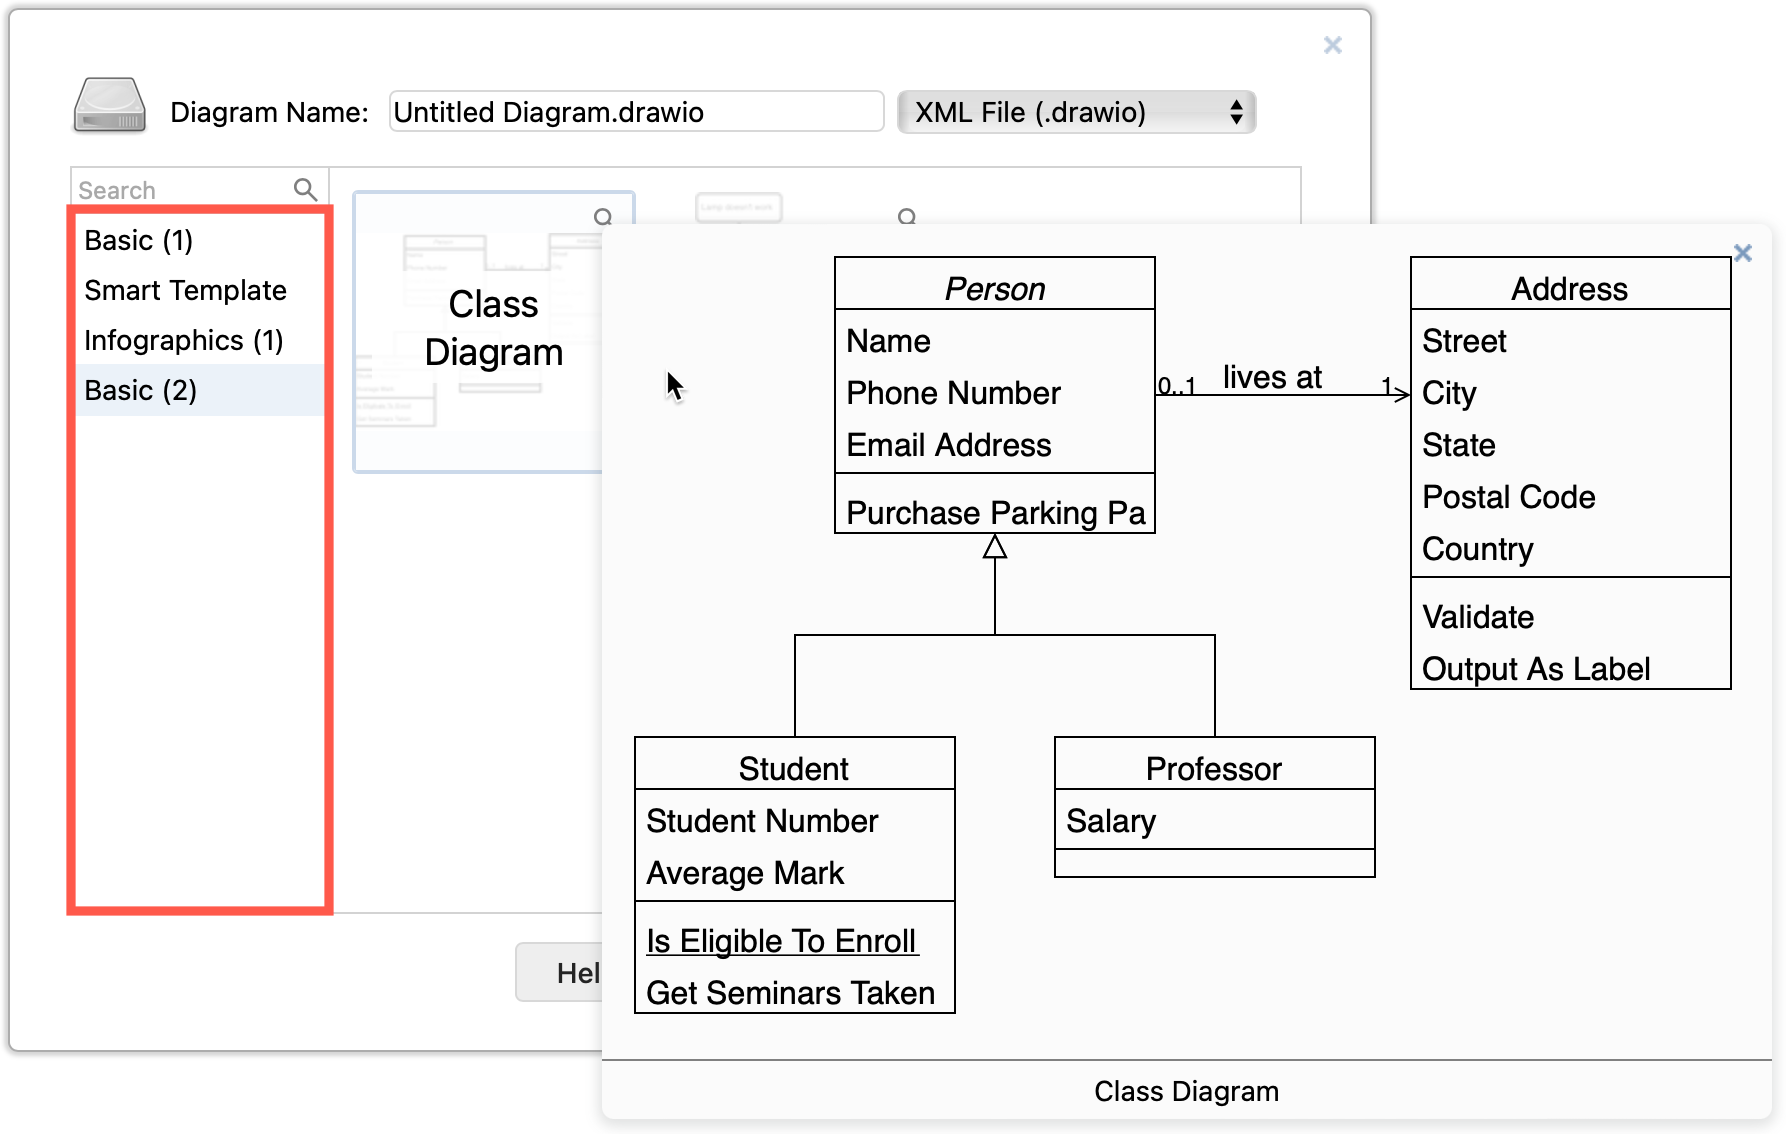
Draw a UML state machine diagram
The concept of state diagrams or state machine graphs has been around since the mid 1900s, long before David Harel modified them into the form used today as part of the UML standard.
Learn how to use diagram templates in diagrams.net
The concept of state diagrams or state machine graphs has been around since the mid 1900s, long before David Harel modified them into the form used today as part of the UML standard.
Marketing teams commonly use 5C situational analyses, simpler SWOT analyses, PEST and PESTLE analyses to examine and improve their products and services. By presenting the information visually, you won’t get bogged down in unnecessary details.
When you slice a 3D shape up and layer it in a diagram, you clearly visualise that a concept or process is broken up into smaller parts. Here’s a step-by-step tutorial to create your own infographic using shapes from the basic diagrams.net shape libraries.
Venn diagrams are widely used in business, education and research to visualise commonalities and differences. Although, you have probably most often seen theme used in memes.
Open this Venn diagram in the diagrams.net viewer
Sequence diagrams show the order of messages that are passed between elements of a system to complete a particular task or use case. The events that cross system boundaries are used by objects and people (actors) to complete their processes.
UML class diagrams are used to illustrate the structure of a computer program. They detail the types of data or attributes stored within each ‘class’, the methods (operations or functions) that each class provides, and the relationships between the classes.
Timelines, roadmap and milestone diagrams feature in a range of documentation - project development documents, infographics and presentations being some of the most common. There are many shapes and templates in diagrams.net and our draw.io branded apps that you can use to quickly draw an attractive diagram that you can embed in your presentation or documentation.
Flowcharts are one of the most used types of diagrams in all teams. But some process flows are circular or cyclical rather than a series of steps with a start and end. You can create circular flowcharts in diagrams.net and our draw.io branded apps in a number of ways.
Ishikawa diagrams, also called fishbone, herringbone or cause and effect diagrams, are used to analyse and identify the root causes of defects or negative events. As most problems have multiple causes, Ishikawa diagrams are a useful prompt to look at the many different contributing factors.
As a type of directed graph, dependency graphs visualise processes or situations where there are dependent components such as in decision making, scheduling, product development, IT or telecommunications infrastructure, supply and manufacturing chains, and more. They help you find the optimal order and identify critical paths or weak links that would constain your application, infrastructure or process.
You can now search for template diagrams and preview templates in the template library at diagrams.net. The new subcategories make it easier to find a specific template diagram in categories with many diagrams, such as the cloud infrastructure templates.
Kanban boards show the breakdown of large projects into smaller tasks that you prioritise and track as they are completed. Collaborative projects benefit from a kanban board as it helps everyone visualise workflows, the state of the project, and the current workload.
Entity relationship diagrams or ER models in software engineering show the structure of and relationships between database objects. They are used extensively in database modelling to plan new systems, and document existing systems for maintenance and updates.
Open this ER model in diagrams.net
Flowcharts are one of the most common diagram types, showing all of the steps that must be followed to complete a process. Not many processes are limited to just one person or one team, which is why swimlane diagrams and cross-functional flowcharts are used - these show the flow of data or control across different groups.
Draw your Amazon Web Services (AWS) infrastructure with diagrams.net for free. You don’t need to register or sign-up, and you can store your diagrams in your favourite cloud storage platforms, like Google Drive, One Drive, and Dropbox.
diagrams.net has a number of shape libraries and templates for creating rack diagrams. Both electronics cabinets can be visualised, as well as IT racks with servers and networking hardware, including those provided by specific vendors like APC, Cisco, Dell, F5, HP, IBM and Oracle.
Network diagrams, or infrastructure diagrams, let you understand a computer network quickly.
Floorplans aren’t only useful for real-estate agents and people who are moving to a new apartment. You can also plan new office spaces, show emergency routes, create a seating chart, plan a conference or trade show layout - anything where you need to arrange people and furniture in a space.
It’s easier to show new development team members your project’s branch structure in your Git repository visually than to describe it in words. Some platforms may illustrate this using built-in tools. If you are using a platform without a convenient visual representation, it’s easy to create your own gitflow diagram.