Set global diagram options in the format panel
If you have nothing selected, in the format panel on the right you’ll see two tabs with options that apply to the entire diagram, features of the diagram editor, and the drawing canvas.
Diagram tab
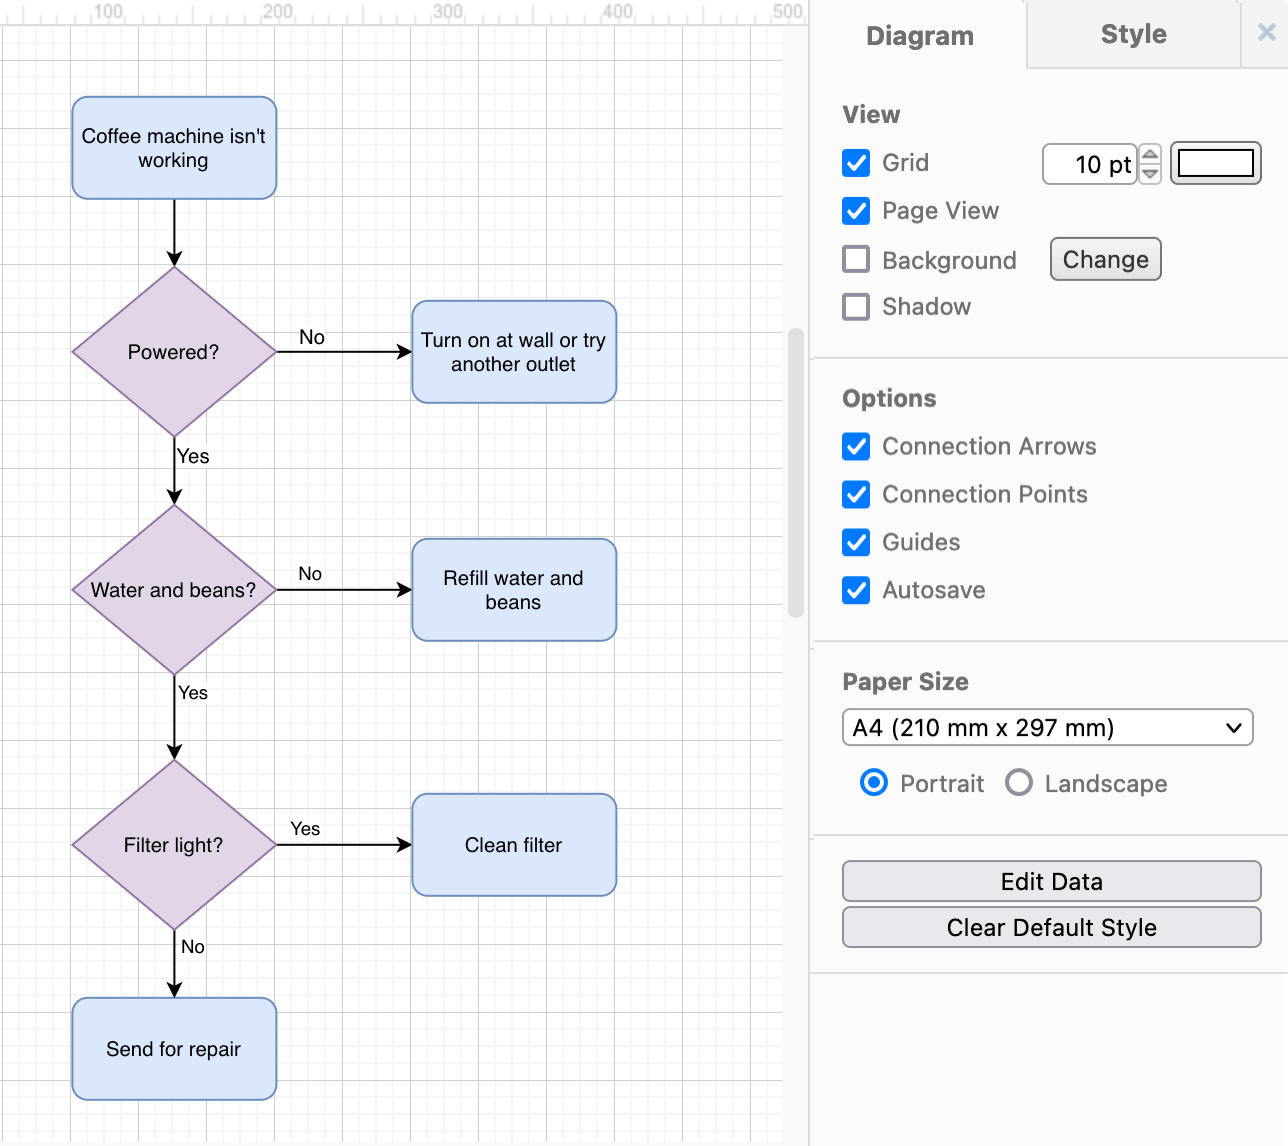
View settings
Grid: Hide or display the diagram editor grid, change its size, or change its colour. The grid is not included when you print or export your diagram - use it to help you align shapes and connectors.
Page View: Expand the grid to fill the entire drawing canvas. Click on Page View again to enable page view again.
Background: Set a coloured background or use a background image instead of using the default transparent background. These will be included when you print your diagram or export it to an image format.
Shadow: Apply a shadow to all elements in your diagram.
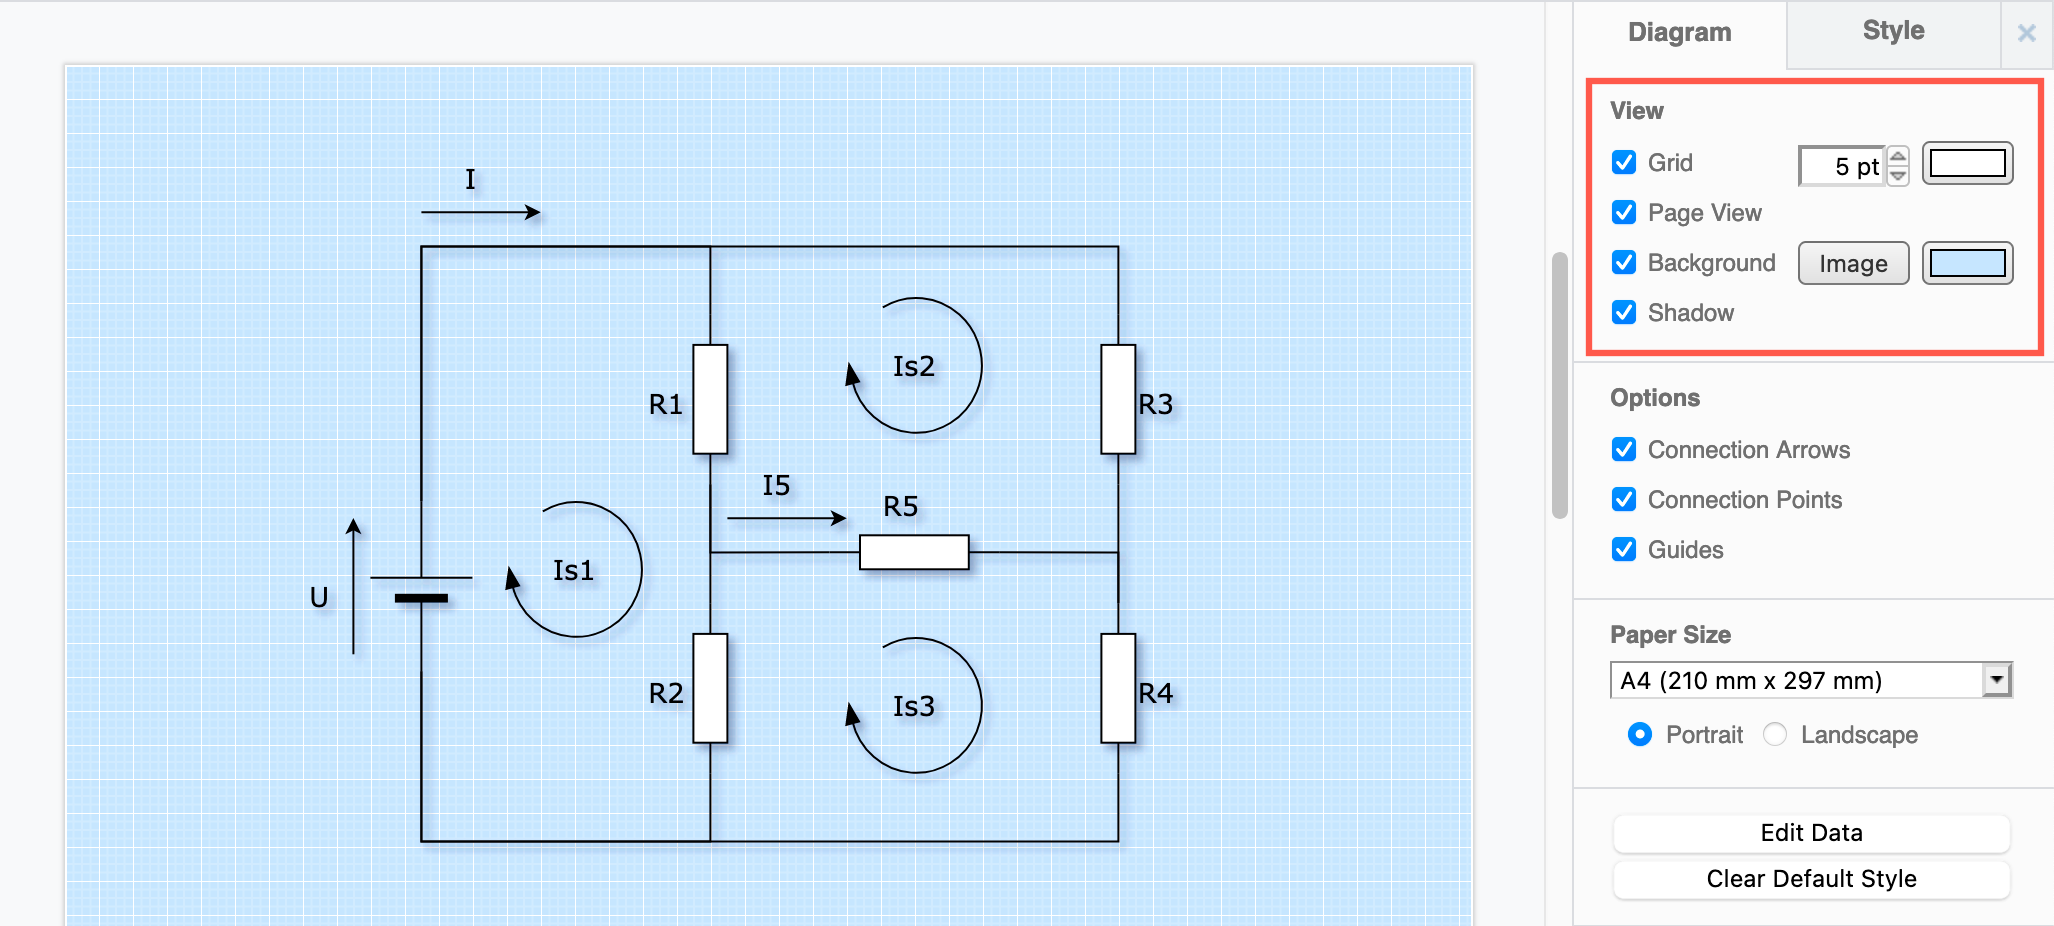
Note: Only use images in your diagram and background that you have a license to use.
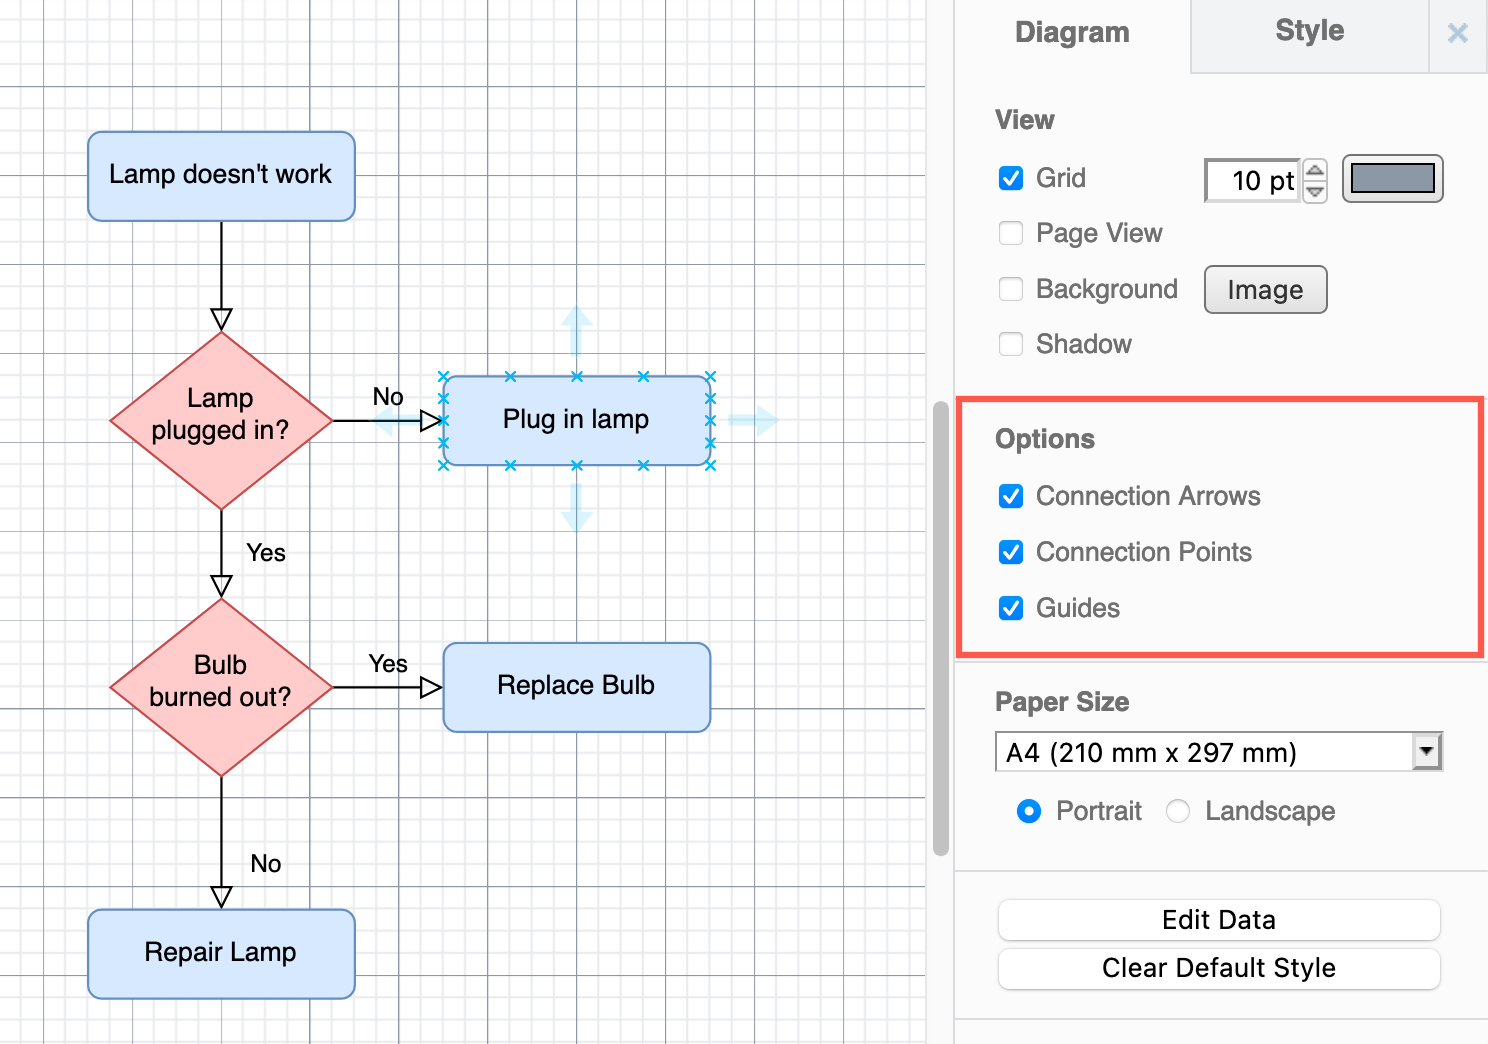
Options
These options change how the diagram editor behaves, by hiding or displaying certain features.
Connection Arrows: Hide or display the four direction arrows that appear when you hover over a shape.
Connection Points: Hide or display the fixed connection points, the little crosses that appear when you hover over a shape.
Guides: Hide or display the blue guidelines that appear when moving or aligning shapes on the drawing canvas.
Autosave: This may or may not be shown depending on where you are storing your diagram files. You can turn off autosave by disabling this checkbox.
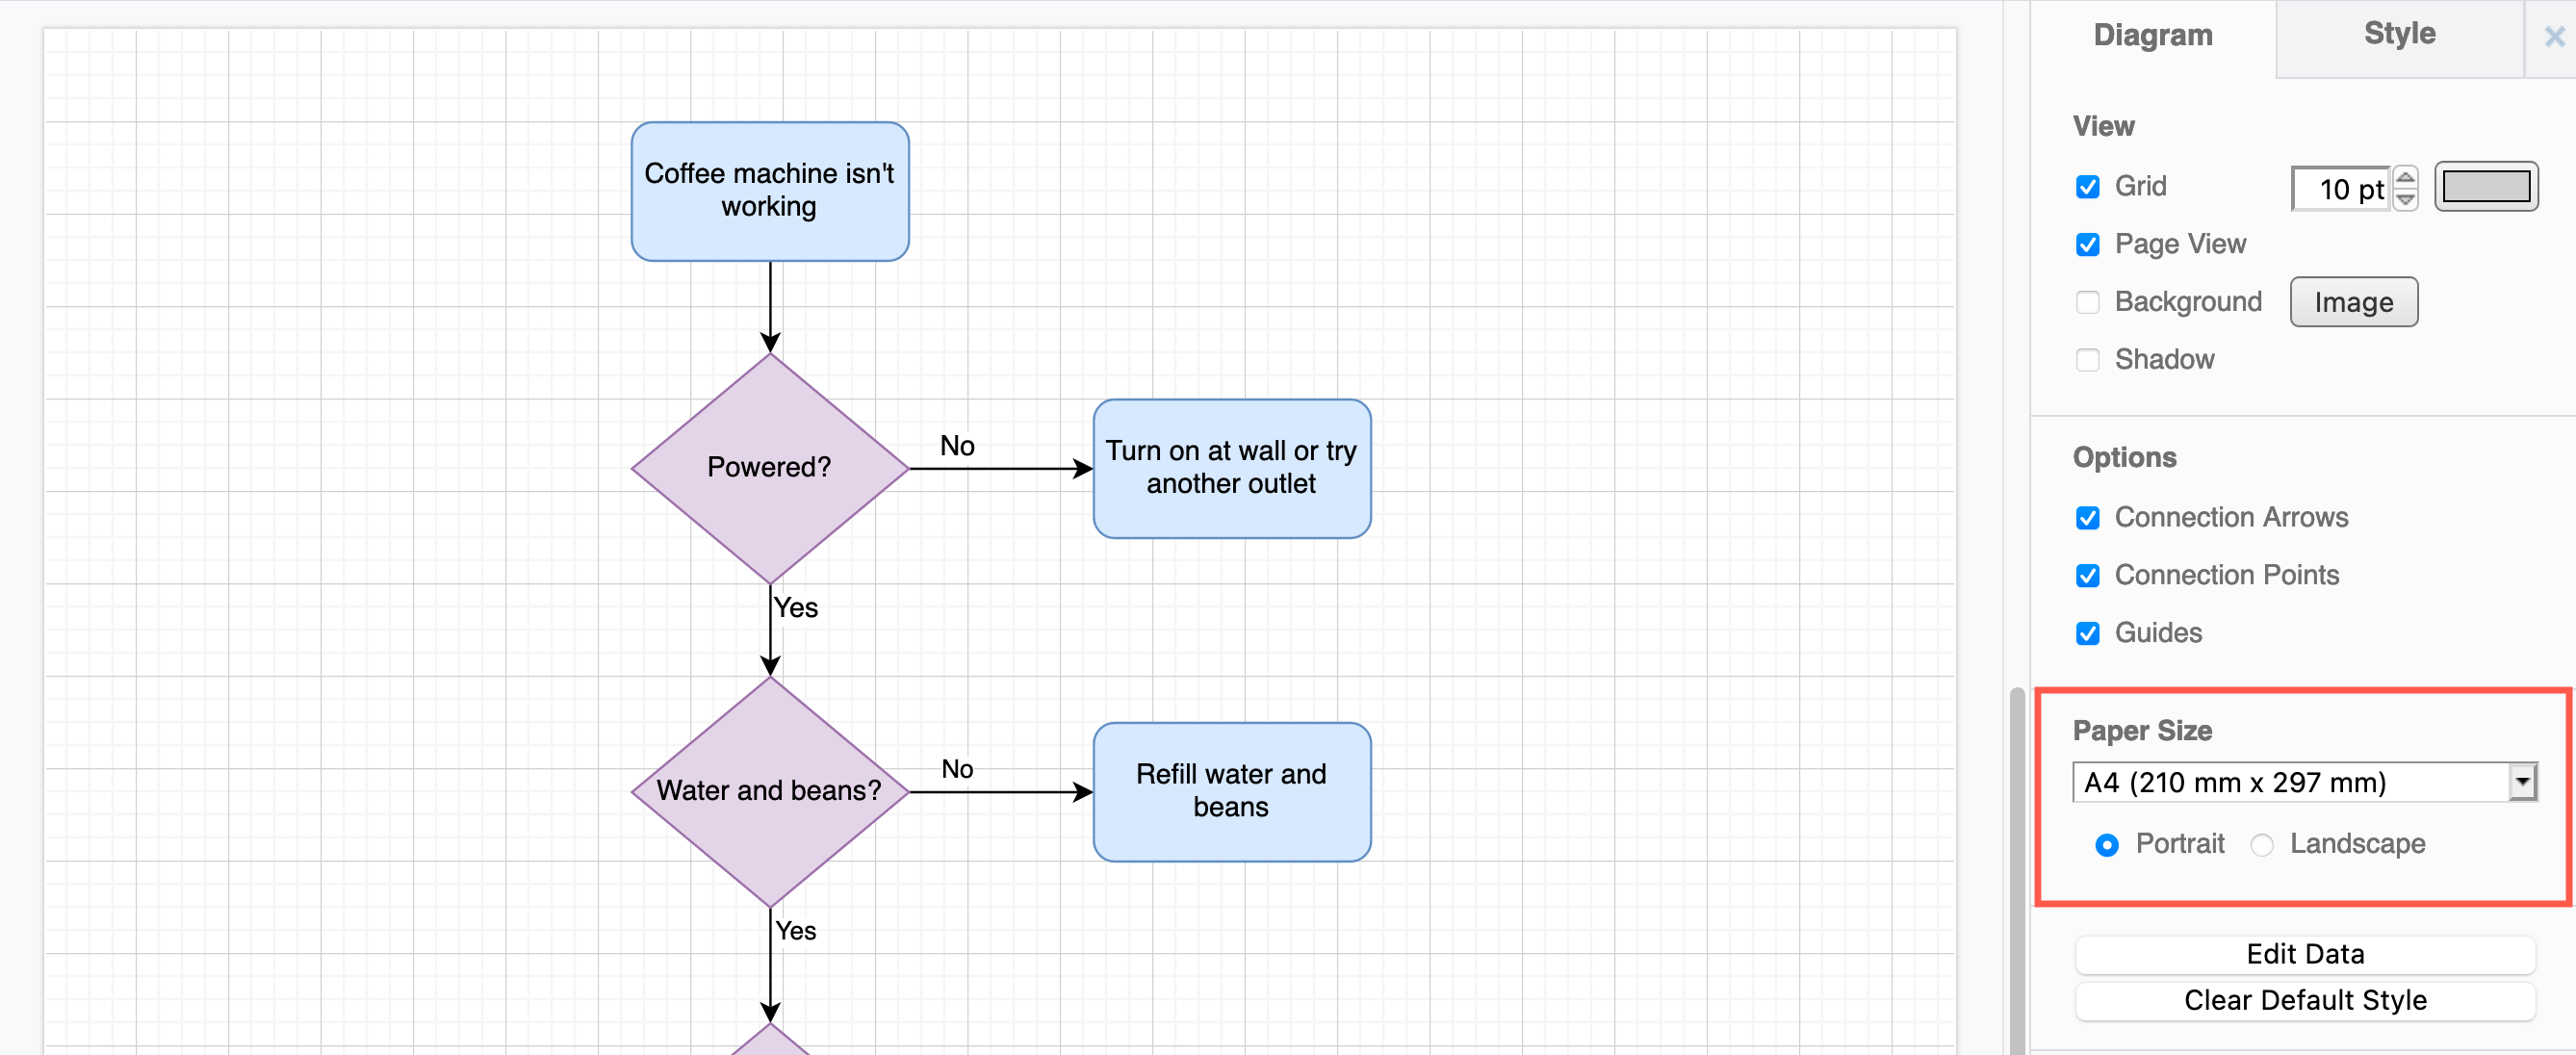
Paper Size
Change the page size or orientation by selecting from the list or setting a custom size. By default, draw.io uses an A4 paper size in a portrait orientation.
Global diagram properties and styles
Edit Data: Add or edit the diagram’s global properties which can be used in placeholders in labels and tooltips.
Clear Default Style Reset the default styles that are applied whenever you add a new shape or connector back to their draw.io default.
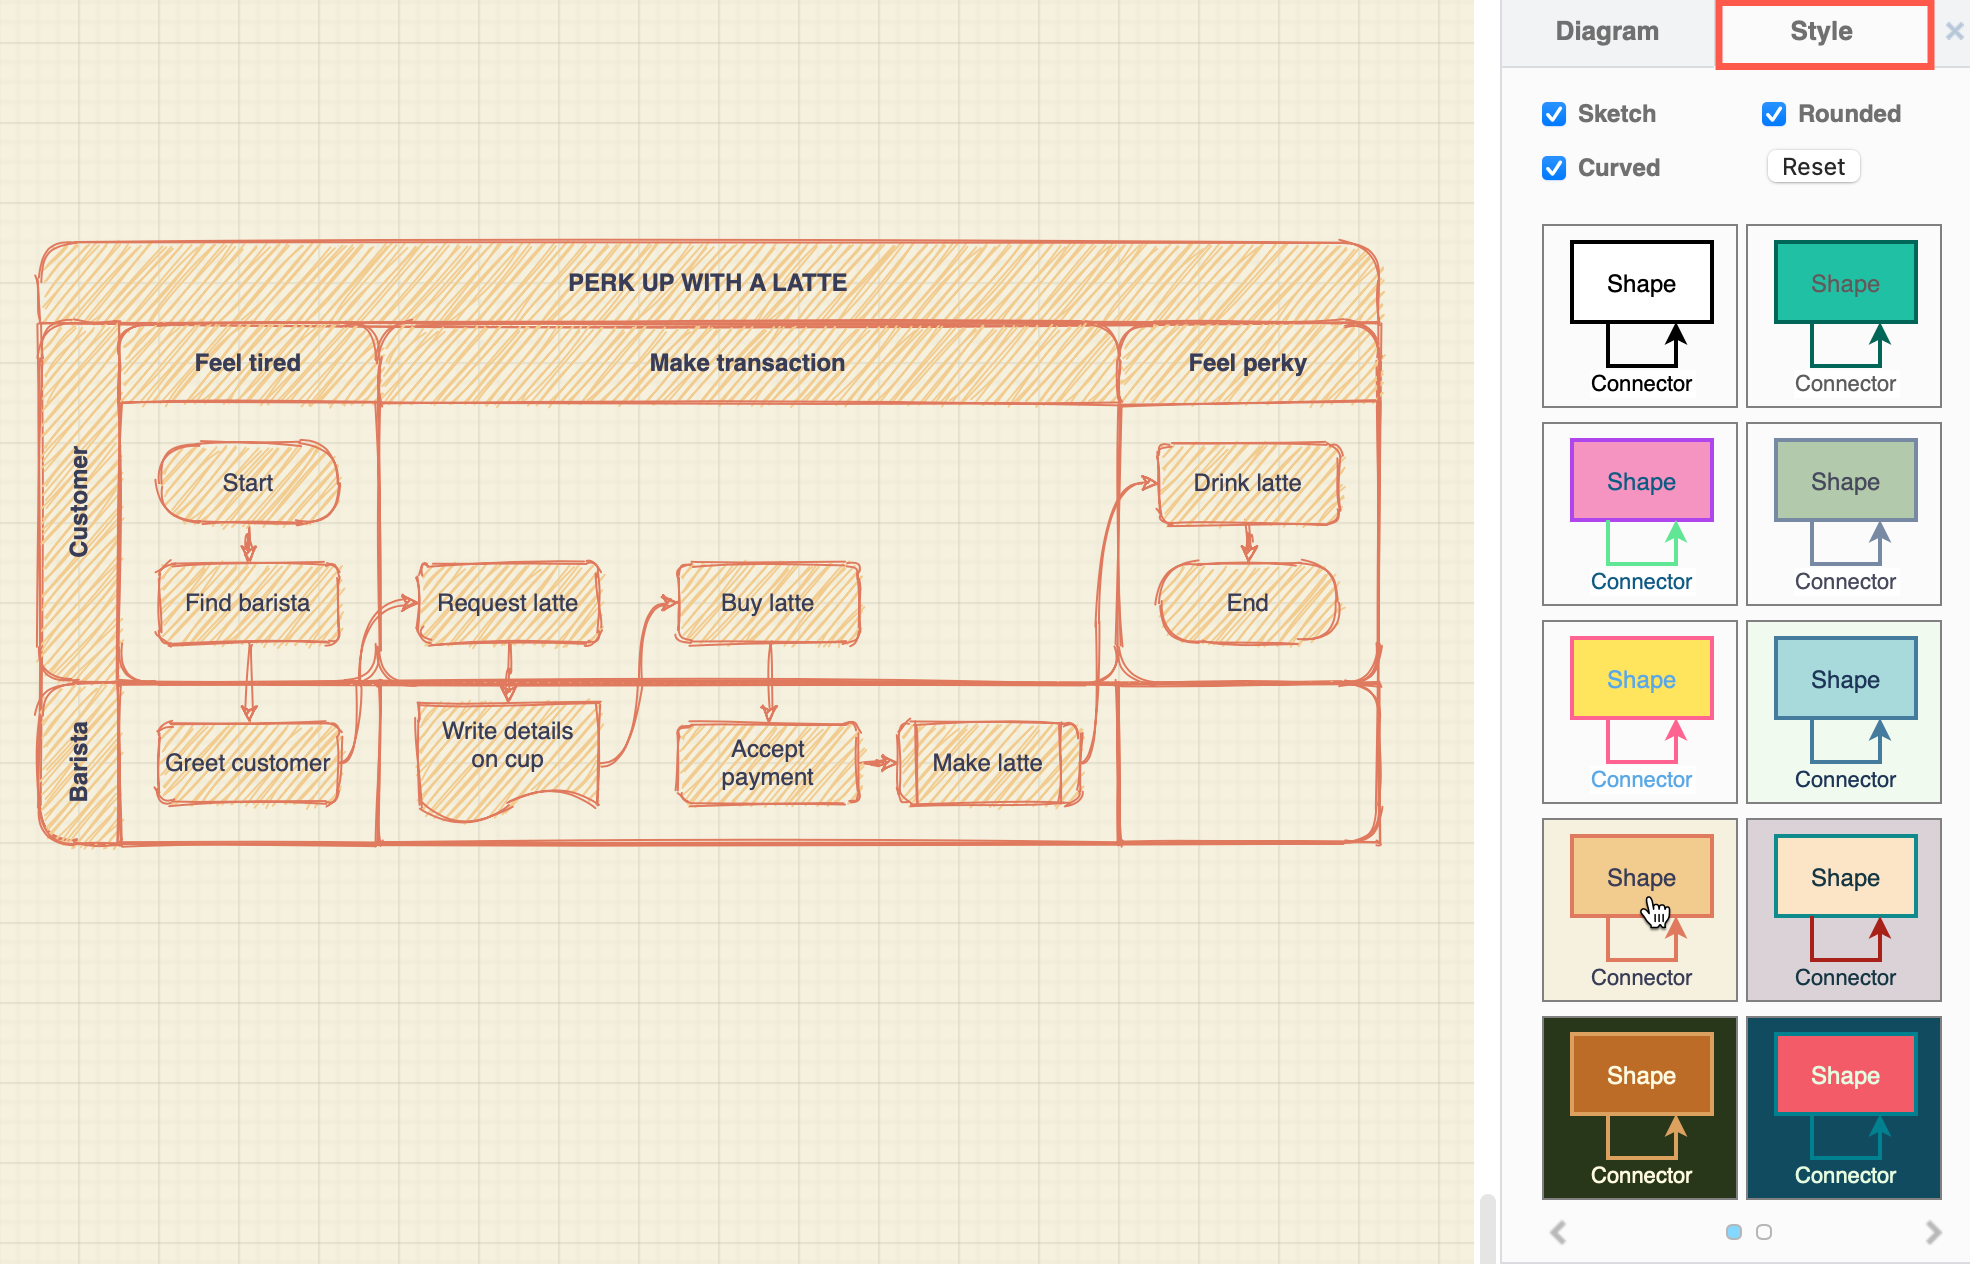
Style tab
Use these options to apply styles globally on all shapes, connectors, text, and the background image and editor grid.
Sketch: Apply the rough Sketch style.
Rounded: Round the corners of all rectangles.
Curved: Curve all connectors.
Reset: Click Reset to set all styles in your diagram back to their defaults.
Style schemes: Select one of the style schemes from the palette to recolour everything in your diagram. Click on the arrows at the bottom of the palette to see more schemes.