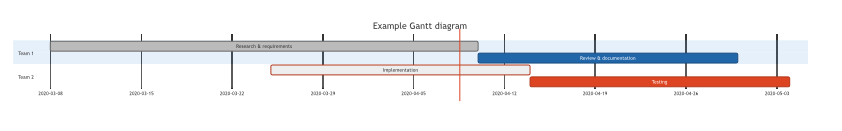
Gantt charts to plan and track anything
If you’ve worked on a project in a team, you’ve probably seen a Gantt chart. These diagrams are used in all industries to plan tasks, note dependencies and track progress. You can create Gantt charts easily in draw.io in a number of different ways.
Draw your own Gantt chart quickly with a table
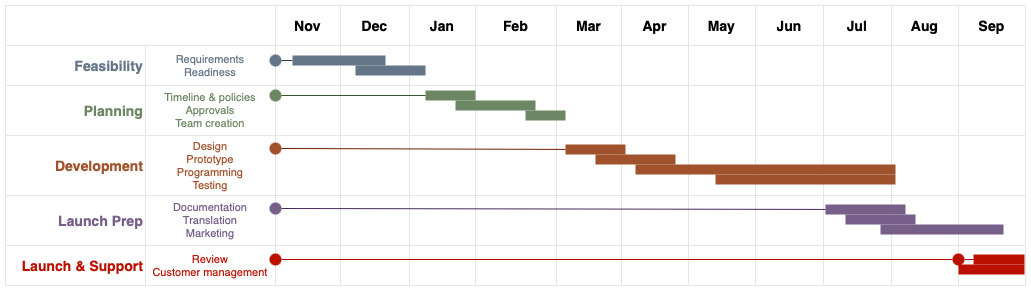
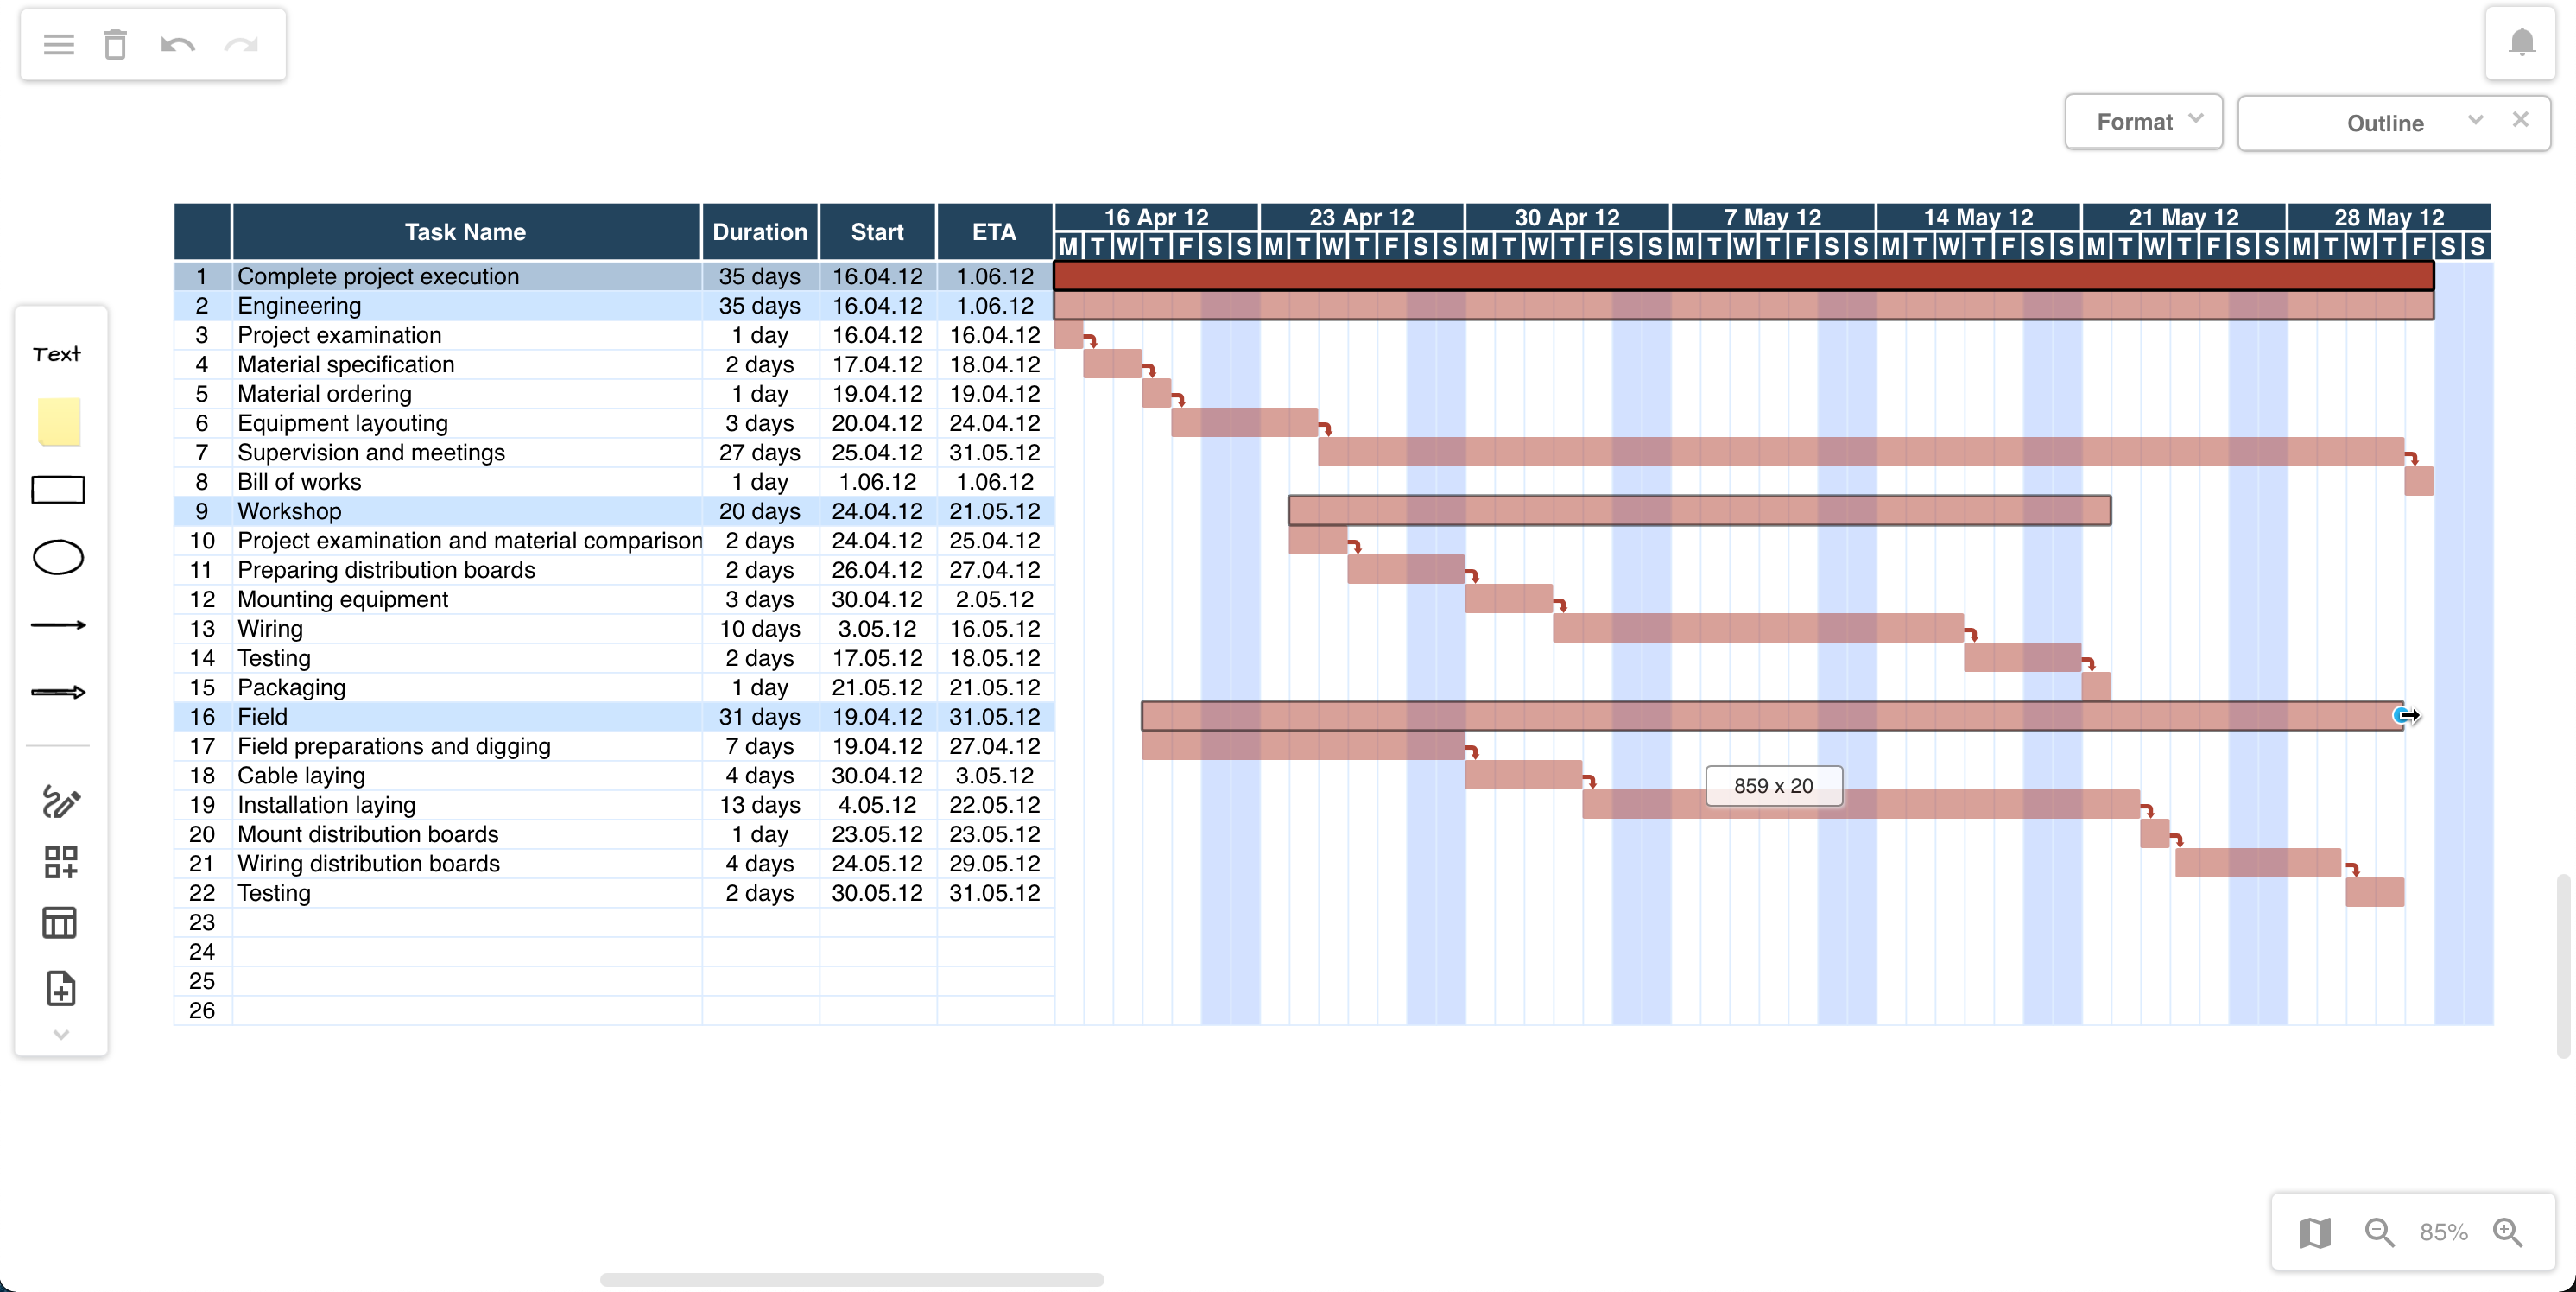
Draw attractive charts for presentations quickly and easily using a table for the Gantt chart structure, overlaid with rectangles and connectors.
-
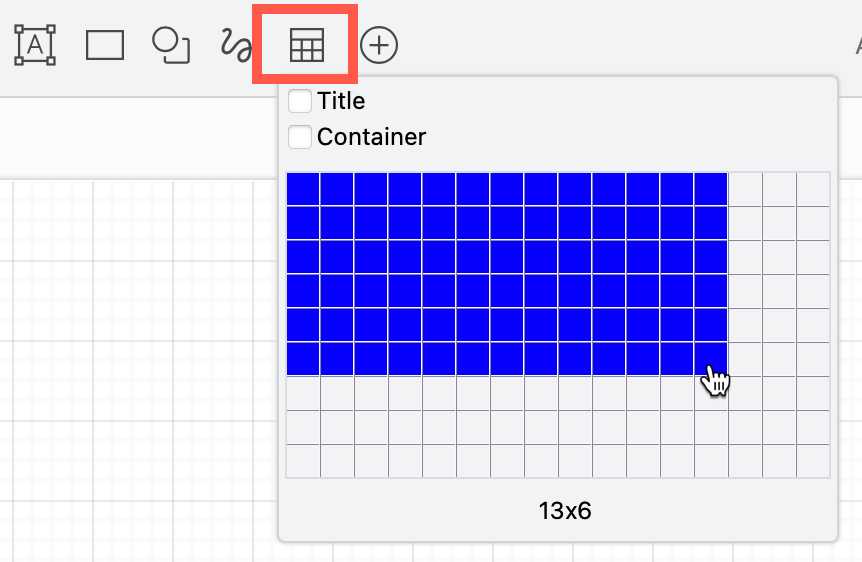
Add a table, enter text and resize the cells to be the foundation of your Gantt chart.
-
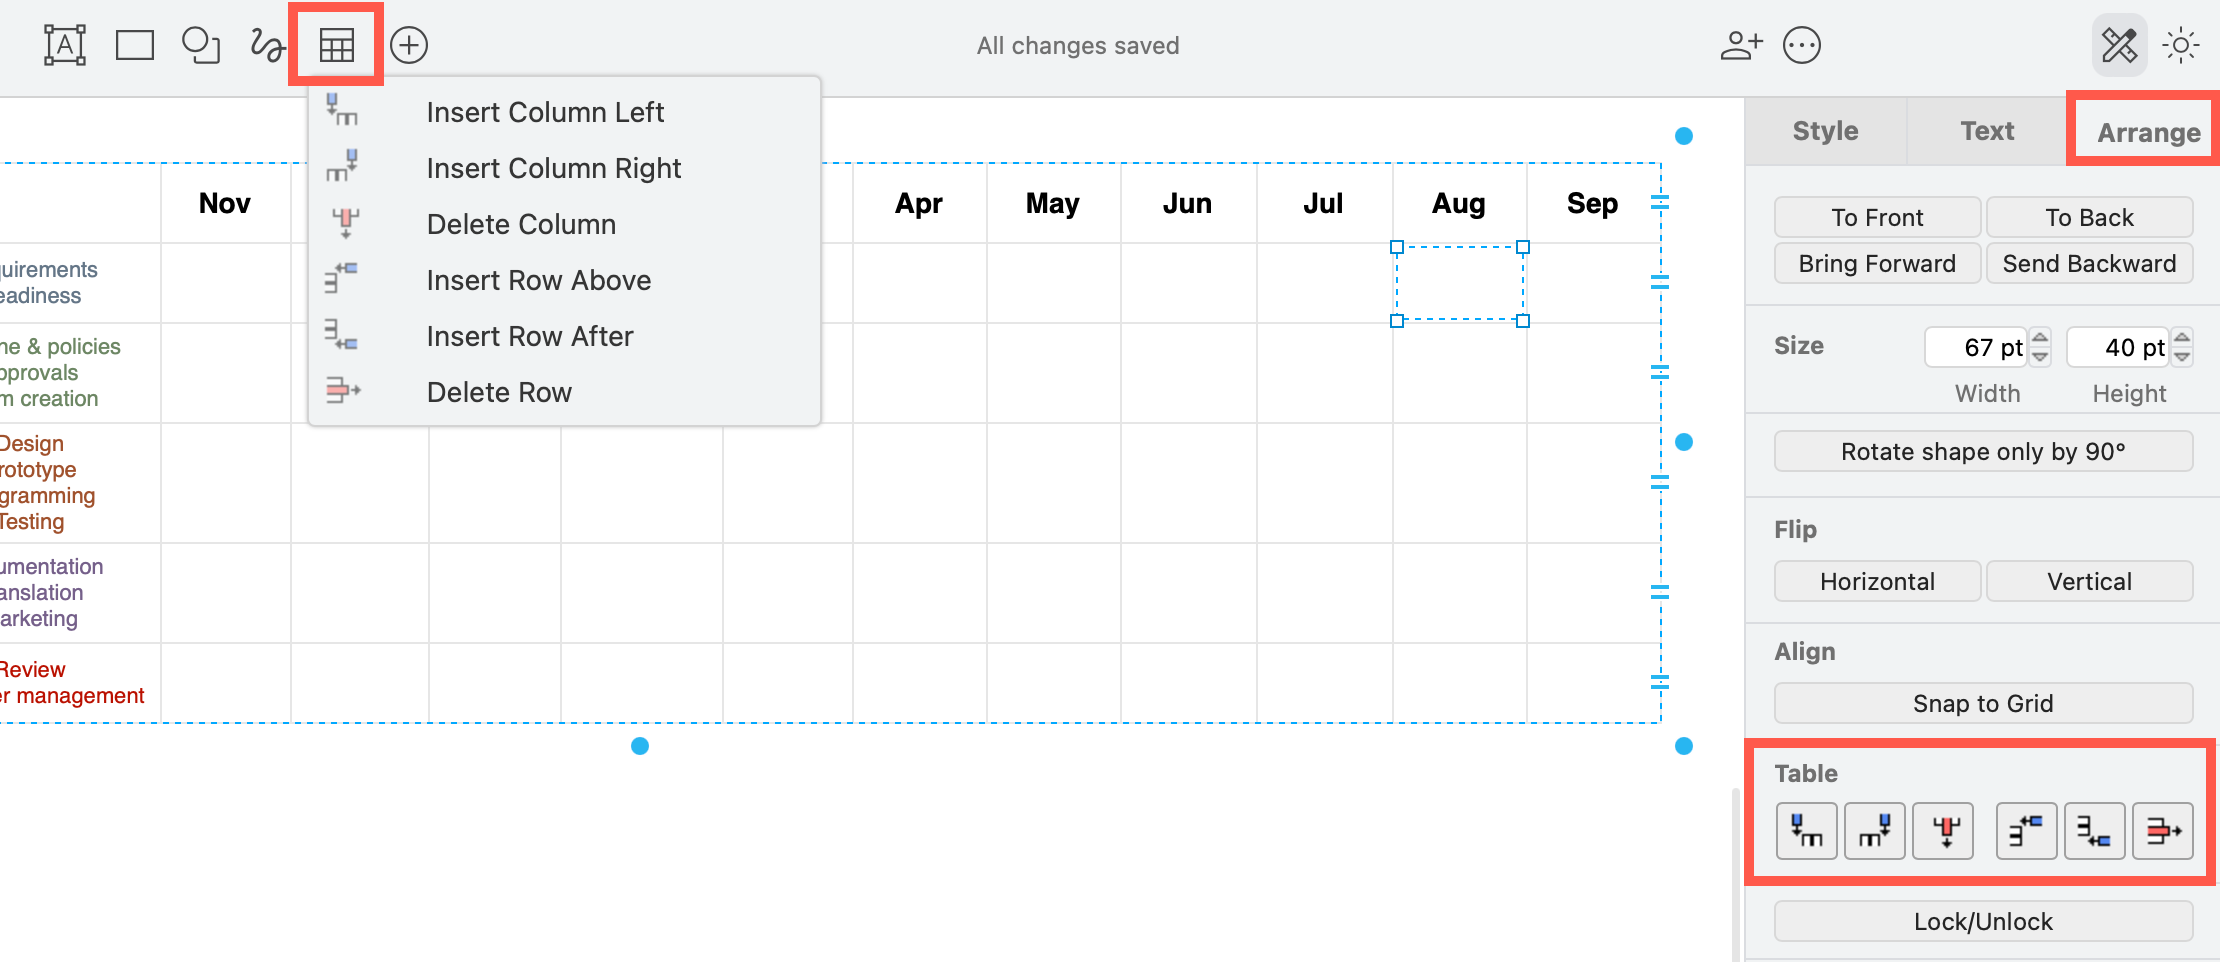
Insert and delete rows and columns in the table with the table tools in the Arrange tab of the format panel, or the toolbar.
-
Drag and drop rectangles over each row.
Note: If you used a container table, hold downAltas you drop the shape so it won’t be added to any particular table cell.
See how to work faster with tables and container tables in draw.io
Gantt templates and shapes in draw.io
Search for Gantt in the Search Shapes field, and add the Gantt Chart shape to the drawing canvas. This is a complex shape composed of many grouped rectangles - it is likely easier to use a table for the chart.
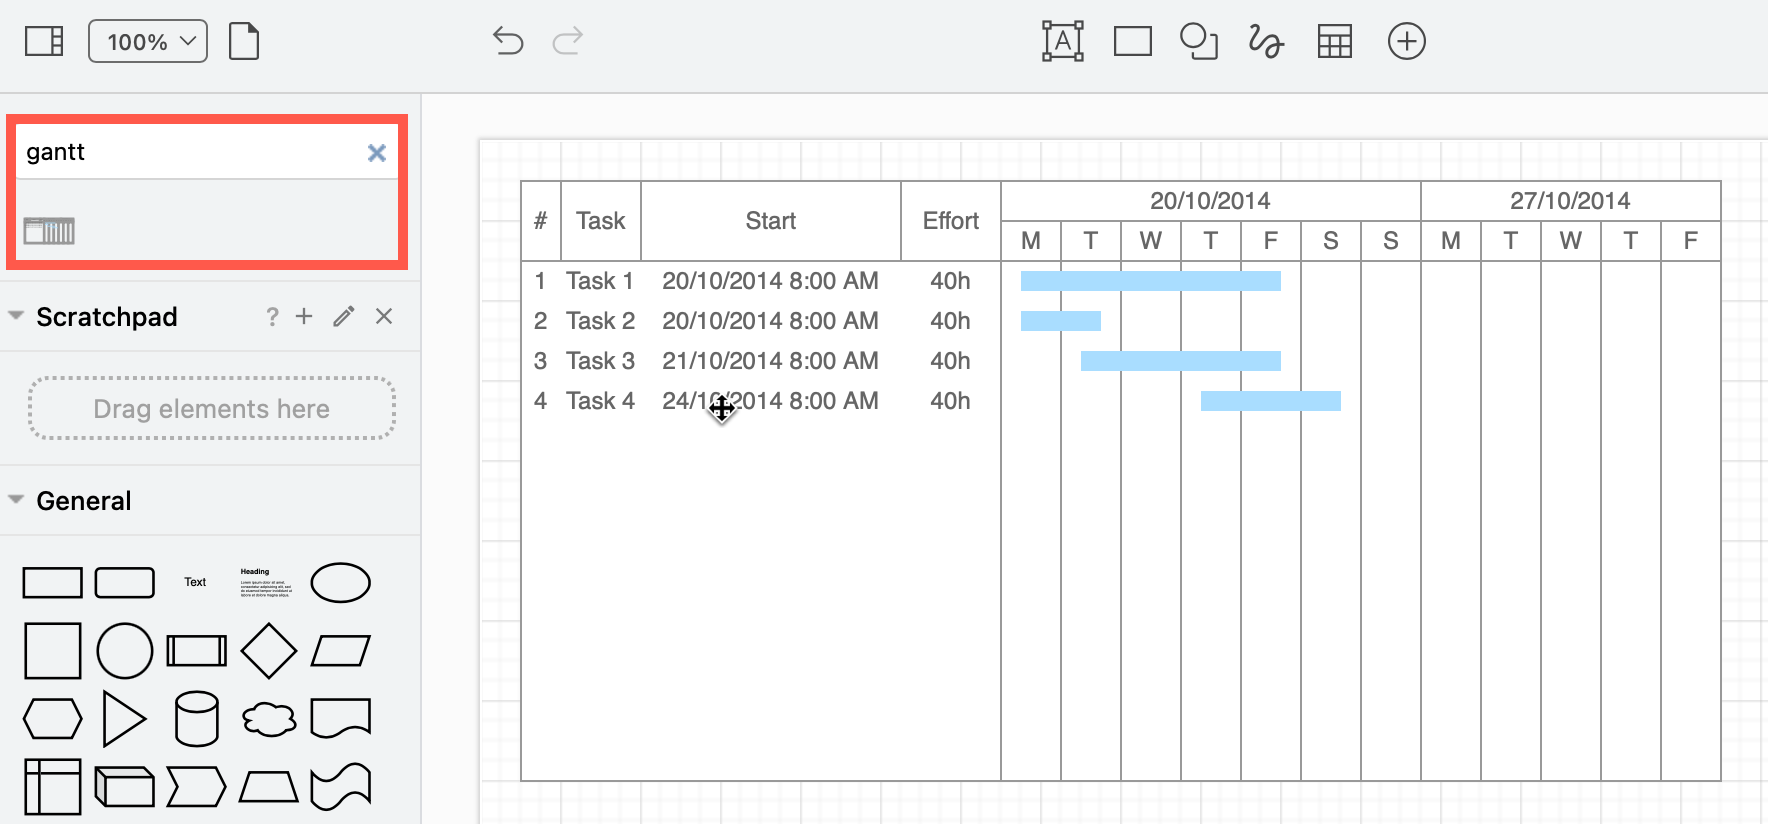
If you do want to use this compound shape, drag to select groups of shapes within the Gantt Chart shape, press Ctrl+C and Ctrl+V to copy and paste them, and drag the new copy into position to extend the chart.
Use a template
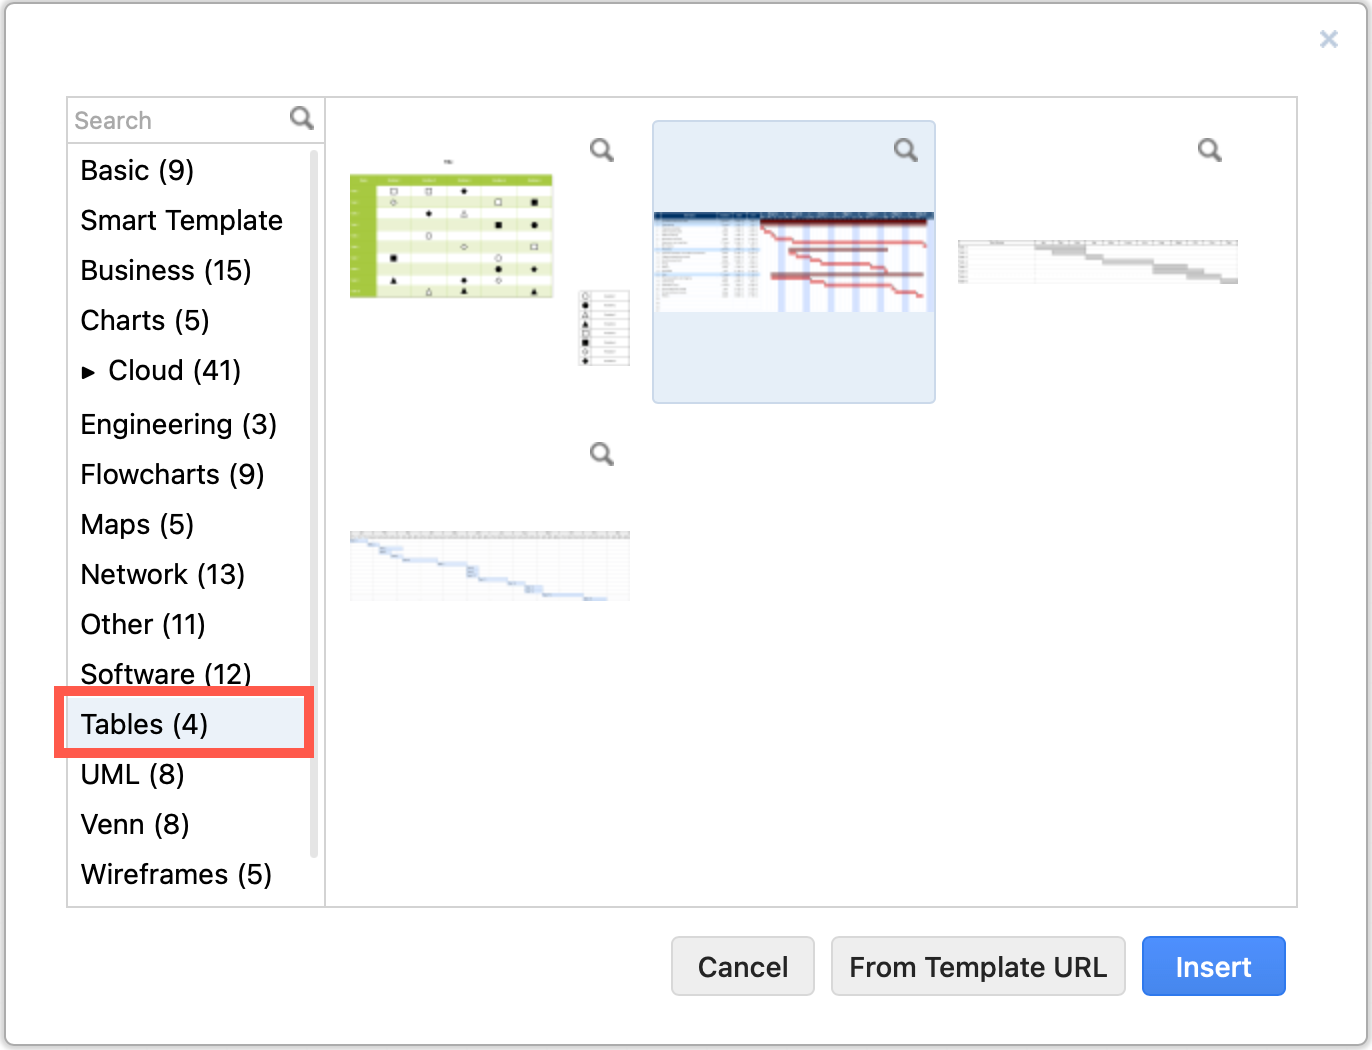
Alternatively, three Gantt chart templates are available in the Tables section of the template library or from our GitHub repository of example diagrams.
Select Arrange > Insert > Template from the menu, or start a new diagram, choose a Gantt template from the Tables category, and click Insert.
Generate Gantt charts from text
- Describe the Gantt chart in Mermaid code, noting which tasks are critical, done, and active, and include any dependencies.
- Select Arrange > Insert > Advanced > Mermaid from the menu, paste the code for your Gantt chart over the example, and click Insert to generate and add it to the drawing canvas.
Generate a smart Gantt chart template
Alternatively, select Arrange > Insert > Template from the menu or start a new diagram to open the template manager. Select Smart Template on the left. Describe your Gantt chart in the text field, select Gantt chart from the list, and click Generate.
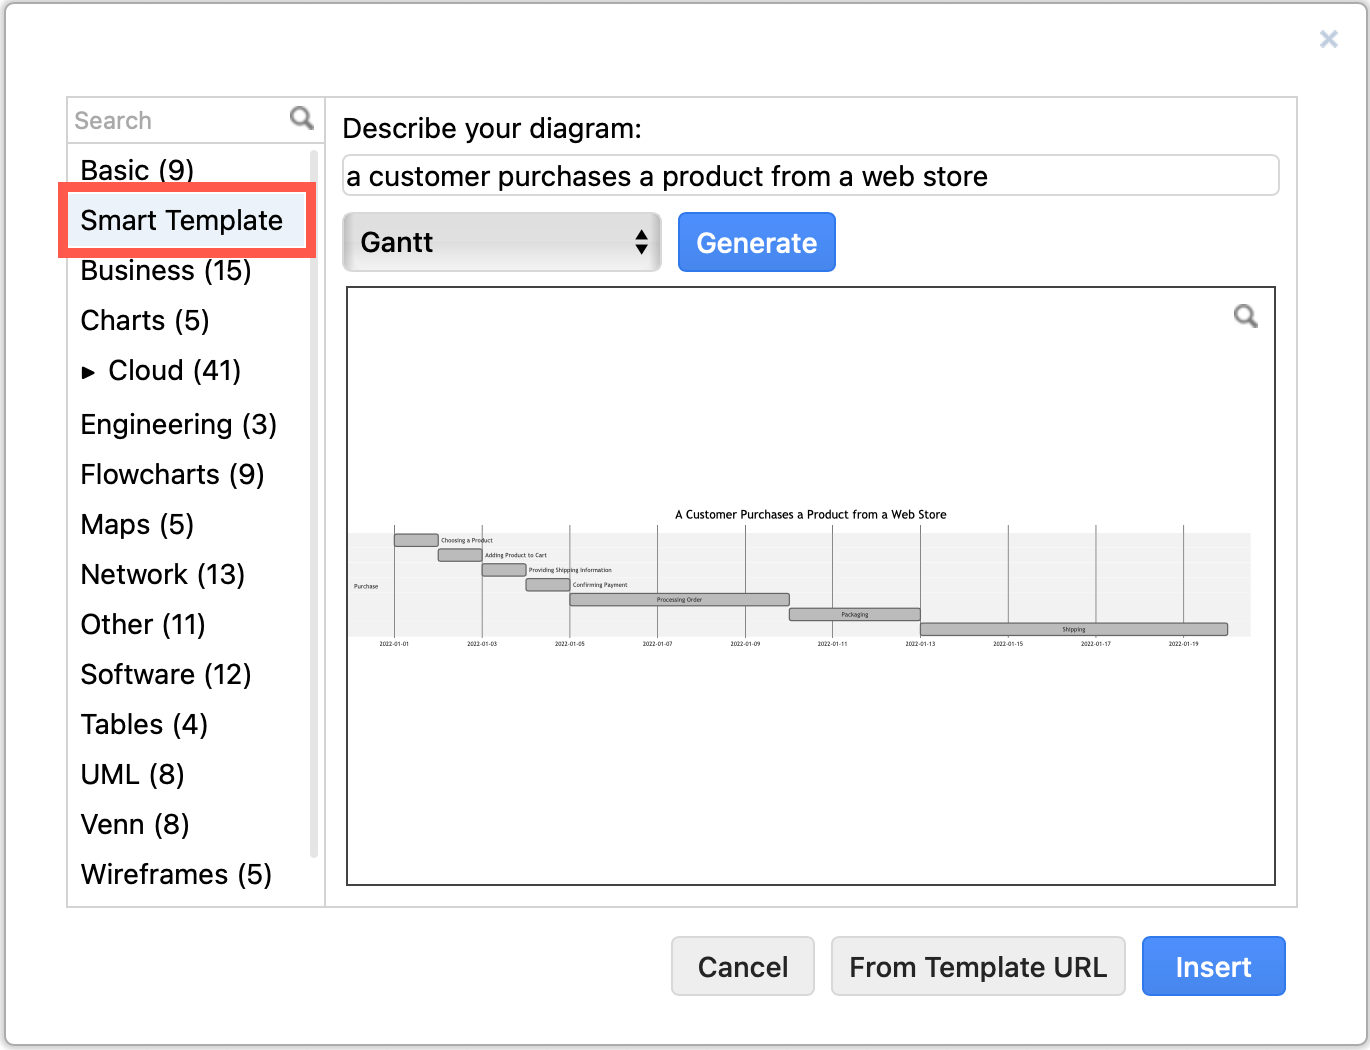
This tool generates a different smart template diagram each time - repeat until you find one that matches your needs or you like the look of, and click Insert to add it to the drawing canvas.
Gantt chart use cases
The obvious uses for Gantt charts are for projects and teams - plan tasks, show sequence and dependencies, track milestones, and schedule resources. But they are used much more widely than this.
You can visualise anything time, duration or cycle-based in a Gantt chart, such as conference events, emergency response to accidents and disasters, supply chains, network usage and outages, and more.
-
Visualise run times through a manufacturing chain for each step. Where there are large gaps or overlaps are likely where problems will occur. Or compare a simulation against actual batch run times.
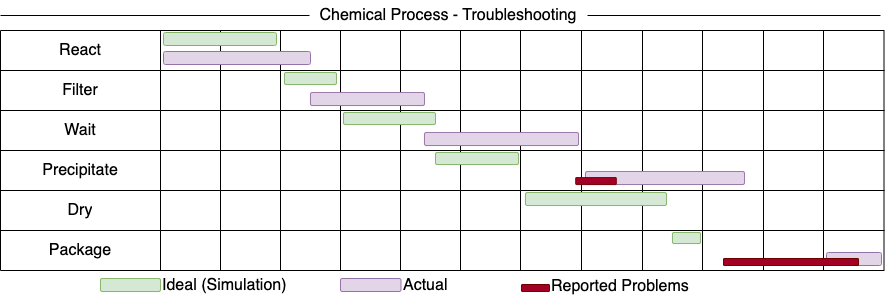
-
Compare run times in a Gantt chart of the same manufacturing process on different days or with different machine setups to see how each step in the process is affected - quality of parts or run time lengths may be affected by temperature, light or humidity.
-
Track your sales or support process by noting durations in a Gantt chart. Look for reasons why certain customer segments are served faster or slower.
-
Add assignment submission dates, preparation time and exams to plan your school or university semester.
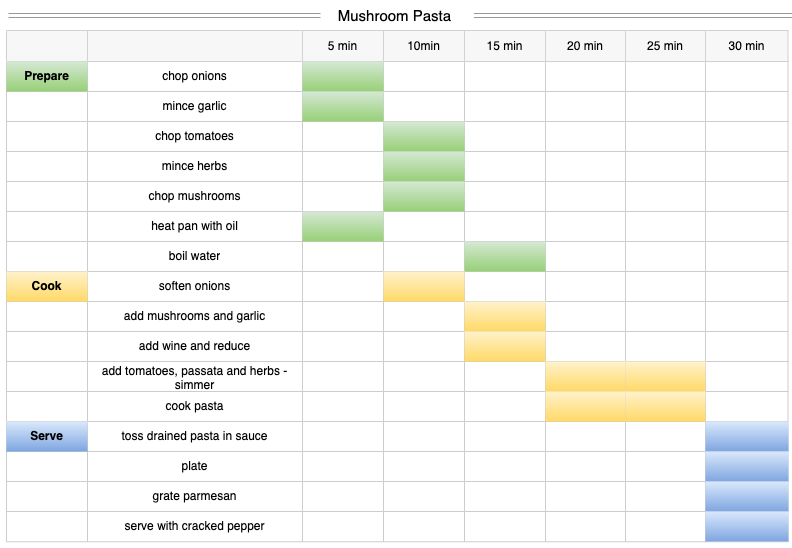
-
Optimise a recipe in a commercial kitchen by visualising each step’s duration in a Gantt chart to speed up time to serve. In the example below, the background of the table cells are filled with colour for a very simple and fast chart.
-
Track and explain medical symptoms to help specialist doctors diagnose issues - very useful for seasonal allergies and other illnesses that are difficult to diagnose.
-
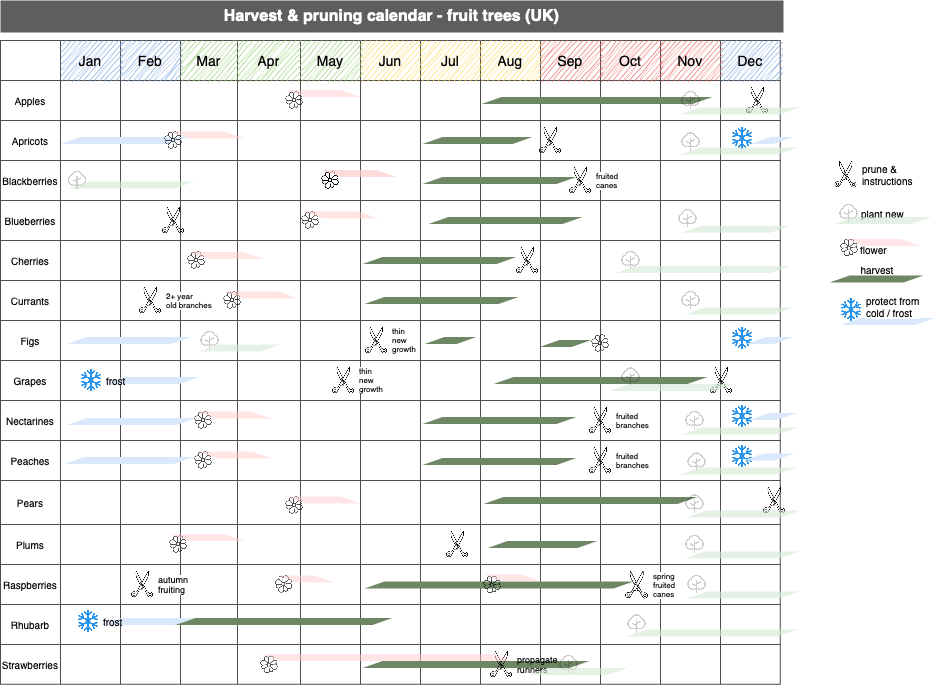
Create a gardening calendar with seed planting and rough harvest dates. Use the dependencies to show successive plantings in one location, or good companion plants. Or use a Gantt chart to show planting, pruning and harvesting dates for common fruit trees.